Visible to Intel only — GUID: GUID-26E0F71C-3977-4508-9E00-6D3E503C7406
Top-down Microarchitecture Analysis Method
OpenMP* Code Analysis Method
Software Optimization for Intel® GPUs (NEW)
Core Utilization in DPDK Apps
PCIe Traffic in DPDK Apps
DPDK Event Device Profiling
Effective Utilization of Intel® Data Direct I/O Technology
Compile a Portable Optimized Binary with the Latest Instruction Set
Analyzing Hot Code Paths Using Flame Graphs (NEW)
Improving Hotspot Observability in a C++ Application Using Flame Graphs
Profiling Games built with Unity* (NEW)
Profiling Games built with Unreal Engine* (NEW)
Profiling Java Applications as a Remote User (NEW)
Profiling JavaScript* Code in Node.js*
Measuring Performance Impact of NUMA in Multi-Processor Systems (NEW)
Analyzing CPU and FPGA (Intel® Arria® 10 GX) Interaction
Profiling a .NET* Core Application
Ingredients
Prepare Your Application for Analysis
Run Advanced Hotspots Analysis
Identify Hotspots in the Managed Code
Optimize the Code with Loop Interchange
Verify the Optimization
Profiling Applications in Amazon Web Services* (AWS) EC2 Instances
Enabling Performance Profiling in GitLab* CI
Configuring a Hyper-V* Virtual Machine for Hardware-Based Hotspots Analysis
Profiling an Application for Performance Anomalies (NEW)
Profiling an OpenMP* Offload Application running on a GPU (NEW)
Profiling a SYCL* Application running on a GPU
Using the Command-Line Interface to Analyze the Performance of a SYCL* Application running on a GPU (NEW)
Profiling an FPGA-driven SYCL* Application
Profiling Hardware Without Intel Sampling Drivers
Profiling MPI Applications
Profiling Docker* Containers
Profiling a Remote Target Through a Proxy Server (NEW)
Using Intel® VTune™ Profiler Server with Visual Studio Code and Intel® DevCloud for oneAPI (NEW)
Using Intel® VTune™ Profiler Server in HPC Clusters
Profiling in a Singularity* Container
Profiling Linux*, Android*, and QNX* System Boot Time
Cache-Related Latency Issues in Segmented Cache Environment
False Sharing
Frequent DRAM Accesses
Poor Port Utilization
Page Faults
Instruction Cache Misses
Inefficient Synchronization
Inefficient TCP/IP Synchronization
OS Thread Migration
OpenMP* Imbalance and Scheduling Overhead
Processor Cores Underutilization: OpenMP* Serial Time
Scheduling Overhead in Intel® Threading Building Blocks (Intel® TBB) Apps
PMDK Application Overhead
Visible to Intel only — GUID: GUID-26E0F71C-3977-4508-9E00-6D3E503C7406
Profiling a .NET* Core Application
This recipe uses Intel® VTune™ Profiler for .NET Core dynamic-code profiling to locate performance hotspots in the managed code and optimize the application turnaround.
Content expert: Denis Pravdin
Ingredients
This section lists the hardware and software tools used for the performance analysis scenario.
Application: a sample C# application that adds all the elements of an integer List. The application is used as a demo and not available for download.
Tools:
Intel® VTune™ Profiler 2018
NOTE:Starting with the 2020 release, Intel® VTune™ Amplifier has been renamed to Intel® VTune™ Profiler.
Most recipes in the Intel® VTune™ Profiler Performance Analysis Cookbook are flexible. You can apply them to different versions of Intel® VTune™ Profiler. In some cases, minor adjustments may be required.
Get the latest version of Intel® VTune™ Profiler:
From the Intel® VTune™ Profiler product page.
Download the latest standalone package from the Intel® oneAPI standalone components page.
Operating system: Microsoft* Windows* 10
CPU: Intel microarchitecture code name Skylake
Prepare Your Application for Analysis
Open a new command window for the .NET environment variables to take effect. Make sure that .NET Core 2.0 is successfully installed:
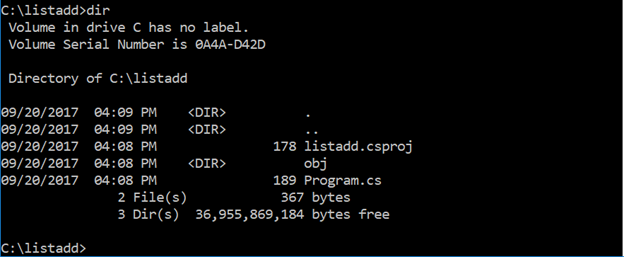
dotnet --versionCreate a new listadd directory for the application:
mkdir C:\listadd
> cd C:\listadd
Enter dotnet new console to create a new skeleton project with the following structure:
Replace the contents of Program.cs in the listadd folder with C# code that adds the elements of an integer List:
using System;
using System.Linq;
using System.Collections.Generic;

namespace listadd
{
    class Program
    {
        static void Main(string[] args)
        {
            Console.WriteLine("Starting calculation...");
            List<int> numbers = Enumerable.Range(1,10000).ToList();
            for (int i =0; i < 100000; i ++)
            {
                ListAdd(numbers);
            }

            Console.WriteLine("Calculation complete");
        }

        static int ListAdd(List<int> candidateList)
        {
            int result = 0;
            foreach (int item in candidateList)
            {
                result += item;
            }

            return result;
        }
    }
}
Create listadd.dll in the C:\listadd\bin\Release\netcoreapp2.0 folder:
dotnet build -c ReleaseRun the sample application:
dotnet C:\listadd\bin\Release\netcoreapp2.0\listadd.dll
Run Advanced Hotspots Analysis
Launch VTune Profiler with administrator privileges.
Click the
 New Project button on the toolbar and specify a name for the new project, for example: dotnet.
 In the Analysis Target window, select local host and Launch Application target type from the left pane.
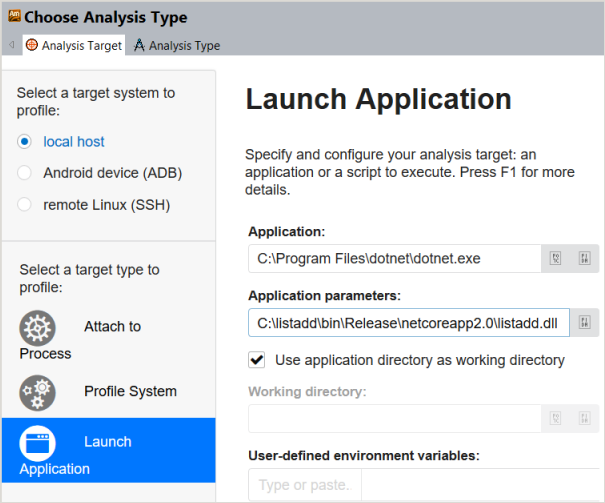
On the Launch Application pane, specify the application to analyze:
Application: C:\Program Files\dotnet\dotnet.exe
Application parameters: C:\listadd\bin\Release\netcoreapp2.0\listadd.dll
 NOTE:
NOTE:The location of dotnet.exe depends on your environment and can be identified with the command: where dotnet.
Click the Choose Analysis button on the right and select the Advanced Hotspots analysis from the left pane.
NOTE:Advanced Hotspots analysis was integrated into the generic Hotspots analysis starting with Intel VTune Amplifier 2019, and is available via the Hardware Event-Based Sampling collection mode.
Click Start to run the analysis.
Identify Hotspots in the Managed Code
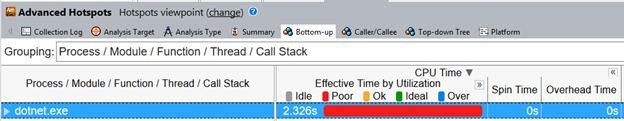
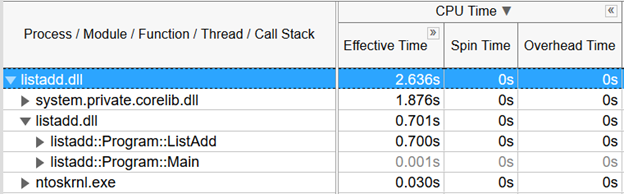
When the collected analysis result opens, switch to the Bottom-up tab and set the data grouping level to Process/Module/Function/Thread/Call Stack:
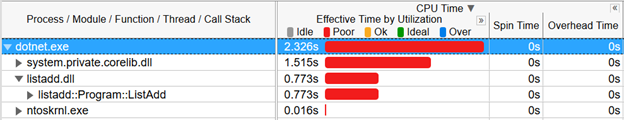
Expanding dotnet.exe > listadd.dll discovers the managed listadd::Program::ListAdd function that took the most CPU Time:
Double-click this hotspot function to open the source view. To view the source and disassembly code side by side, click the Assembly toggle button on the toolbar:
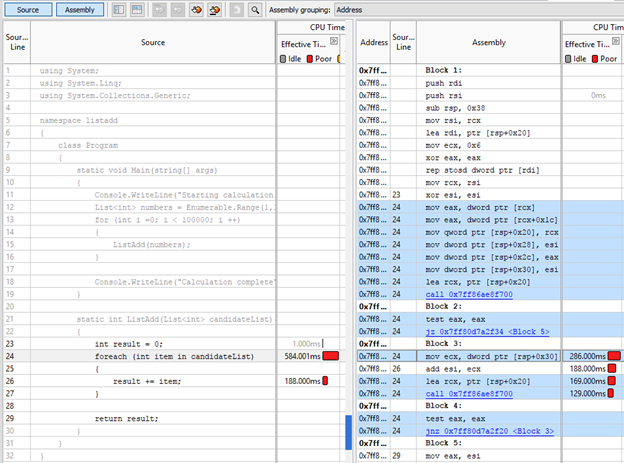
Use the statistics per source line/assembly instruction to identify the most time-consuming code snippets (line 24 in the example above) and work on optimizations.
Optimize the Code with Loop Interchange
VTune Amplifier highlights the following code line as performance-critical:
foreach (int item in candidateList)
For optimization, consider using the for loop statement. Replace the contents of Program.cs with this C# code:
using System;
using System.Linq;
using System.Collections.Generic;

namespace listadd
{
    class Program
    {
        static void Main(string[] args)
        {
            Console.WriteLine("Starting calculation...");
            List<int> numbers = Enumerable.Range(1,10000).ToList();
            for (int i =0; i < 100000; i ++)
            {
                ListAdd(numbers);
            }

            Console.WriteLine("Calculation complete");
        }

        static int ListAdd(List<int> candidateList)
        {
            int result = 0;
            for (int i = 0; i < candidateList.Count; i++)
            {
                result += candidateList[i];
            }

            return result;
        }
    }
}
Verify the Optimization
To verify the optimization for the updated code, re-run the Advanced Hotspots analysis.
Before the optimization the sample application took 2.636 seconds of CPU time:
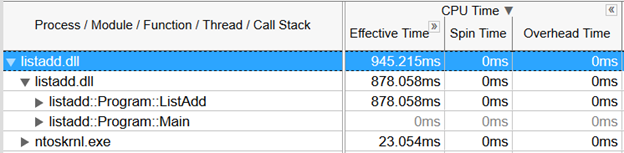
After optimization the application ran for 0.945s, which is a 64% reduction in time over the original:
NOTE:
To discuss this recipe, visit the developer forum
Parent topic: Configuration Recipes