Measuring Performance Impact of NUMA in Multi-Processor Systems
Use this recipe to measure the performance impact of non-uniform memory access (NUMA) in multi-processor systems. This recipe uses the Intel® VTune™ Profiler-Platform Profiler application.
application is available as a separate download. Access this application from the Intel Registration Center.
The Platform Profiler application will be discontinued in a future release. As a workaround, consider using the EMON data collector. To learn more, see this transition article.
- To collect platform behavior data using the 2023.2 or newer versions of VTune Profiler, use the standalone Platform Profiler collector. You can then visualize collected data with the Platform Profiler server. See Platform Analysis for more information.
- The Platform Profiler analysis type is not available in versions of VTune Profiler newer than 2023.2. To use the Platform Profiler analysis type (from the GUI or command line), switch to a version of VTune Profiler older than 2023.2. You can then follow procedures described in Platform Profiler Analysis.
Content expert: Jeffrey Reinemann
Non-uniform memory access (NUMA) is a computer memory design where the time for memory access depends on the location of memory relative to the processor. In NUMA, processor cores can access local memory (where the memory connected to the processor) faster than non-local memory (where the is memory connected to another processor or shared between processors).
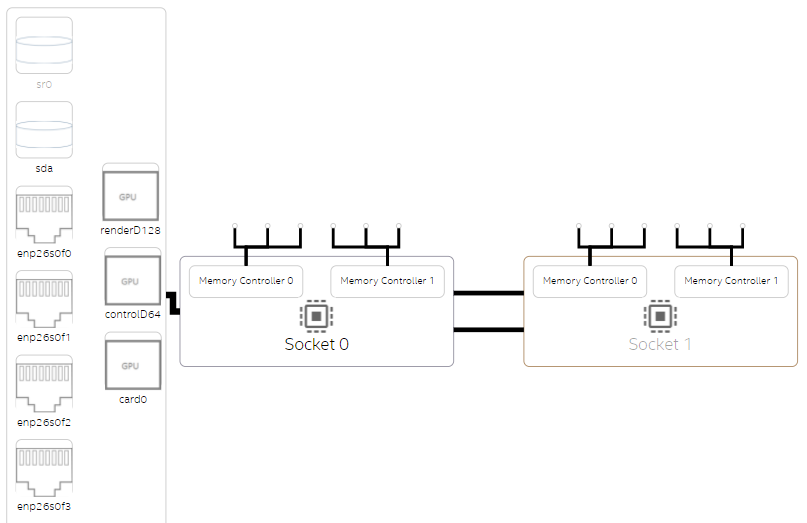
This figure illustrates the design of a two-processor NUMA system.
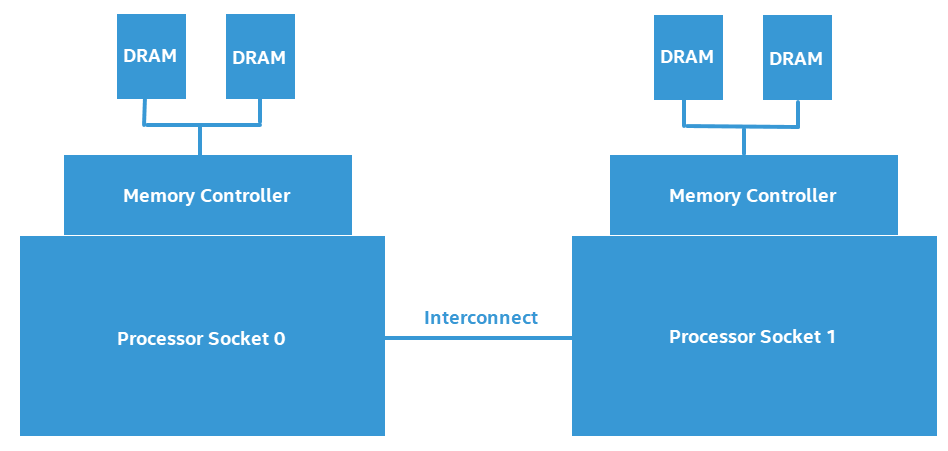
Software that frequently accesses non-local (or remote) memory can suffer a measurable negative performance impact when compared to software that primarily accesses local memory. In this recipe, we look at measuring the negative performance impact of a NUMA system.
Ingredients
This section lists the hardware and software tools used in this scenario.
Application: The sample application used in this recipe is not available for download.
Tool: Intel® VTune™ Profiler-Platform Profiler
Run Platform Analysis
Intel® VTune™ Profiler-Platform Profiler consists of a data collector (run from the command line) and a server implementing a RESTful interface to a time series database. To collect and view platform profiler metrics, you must:
- Collect data using the data collector on the command line.
- Import and view results in the Platform Profiler server.
Set up the environment for Platform Profiler collector. Run vpp-collect-vars.
In a Linux* environment, run this command:
source <INSTALL_DIR>/vpp/collect/vpp-collect-vars.sh
If you have not loaded SEP drivers already, run:
vpp-collect config
In a Windows* environment, run this command:
<INSTALL_DIR>\vpp\collector\vpp-collect-vars.cmd
Start data collection. Run this command:
vpp-collect start -c 'optional comment about data collection'
If you want to insert marks in the data timeline, run:
vpp-collect mark 'optional comment about workload transition'
Stop data collection. Run this command:
vpp-collect stop
After data collection completes, Platform Profiler compresses the results into a .tgz (Linux) or .zip (Windows) file whose name contains the name of the target system and a date/time stamp.
You view results in the Platform Profiler server. Follow these steps:
Set up the environment for Platform Profiler server. Run vpp-server-vars.
In a Linux environment, run this command:
source <INSTALL_DIR>/vpp/server/vpp-server-vars.sh
In a Windows environment, run this command:
<INSTALL_DIR>\vpp\server\vpp-server-vars.cmd
NOTE:When setting up the environment for the first time, make sure you have root/administrator access privileges.Create the virtual Python* environment for Platform Profiler server. Run:
vpp-server config
Start the Platform Profiler server. Run this command:
vpp-server start
If necessary, specify the location of the database (for results) and a passphrase for access.
Open a web browser to the address and port number of the server instance of Intel® VTune™ Profiler-Platform Profiler (e.g., localhost:6543)
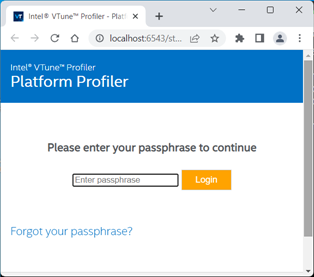
Enter the database access password.
Import the Platform Profiler collector results file. In the View Results tab, click the Upload button.
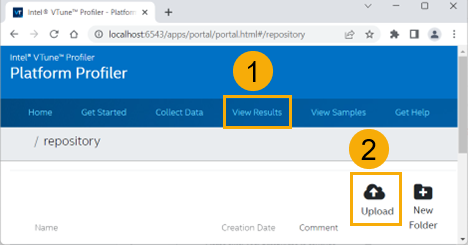
After the import completes, Platform Profiler displays information in three key areas:
- The Platform configuration diagram
- An interactive time line
- Detailed performance data charts
Identify NUMA Issues
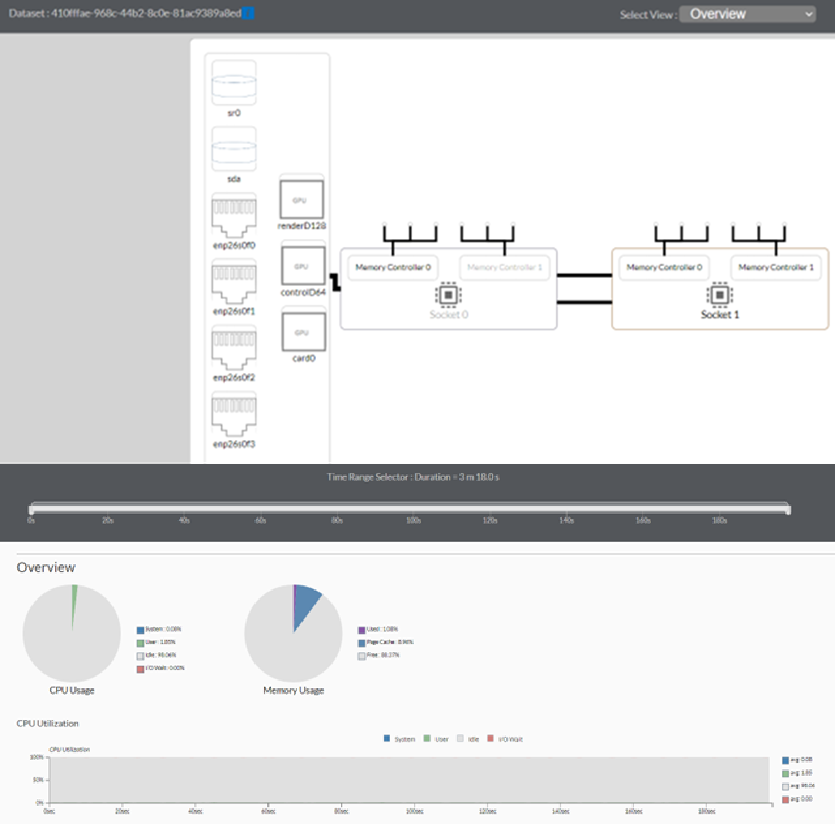
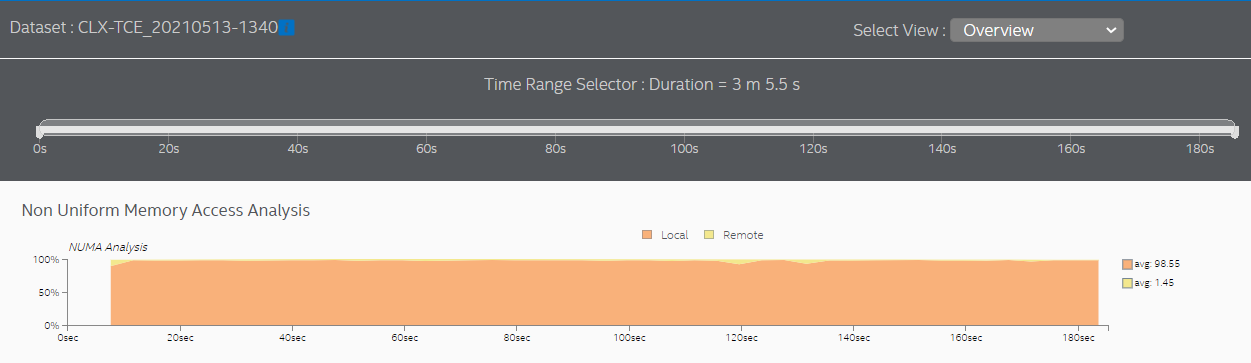
Start your analysis of NUMA issues by selecting Overview in the Select View pulldown menu. In the system configuration overview, you can see that a NUMA system typically has multiple processor sockets, each of which has memory controllers. This diagram is an example of a platform diagram for a two-socket system.
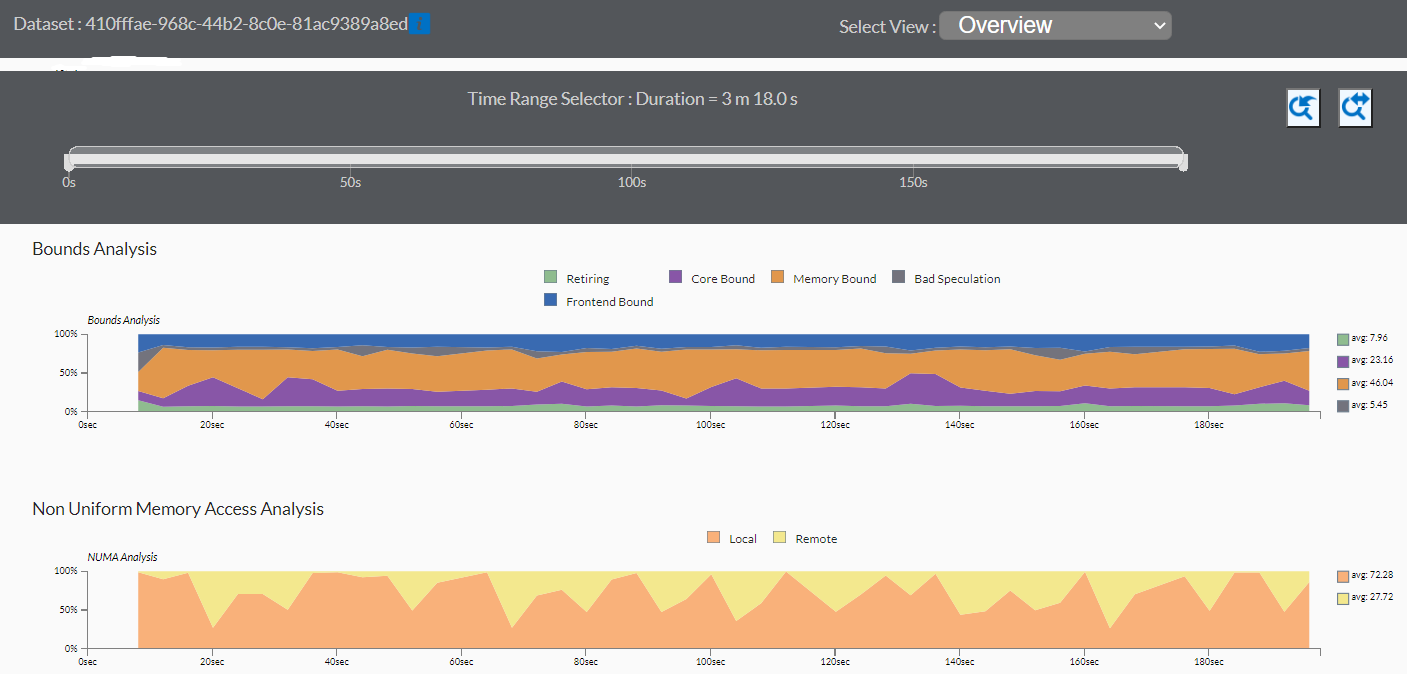
In the case of the sample application used here. the performance is mostly bound by memory access. There are a high number of memory accesses that are targeted to remote memory.
See the Non-Uniform Memory Access Analysis graph to compare local vs. remote memory accesses over time. A high percentage of remote accesses indicates a NUMA related performance issue.
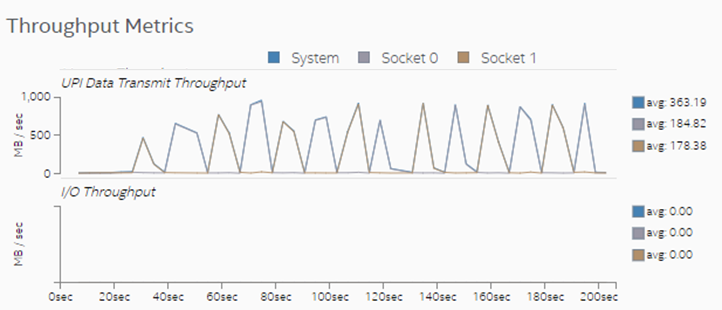
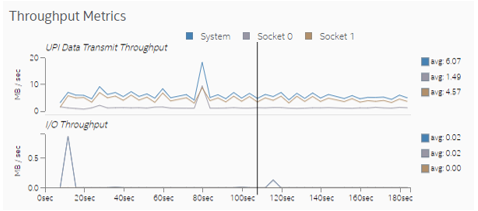
Observe the Throughput Metrics section. In this sample application, there are frequent spikes in cross-socket (UPI) traffic. These spikes correspond to remote memory accesses.
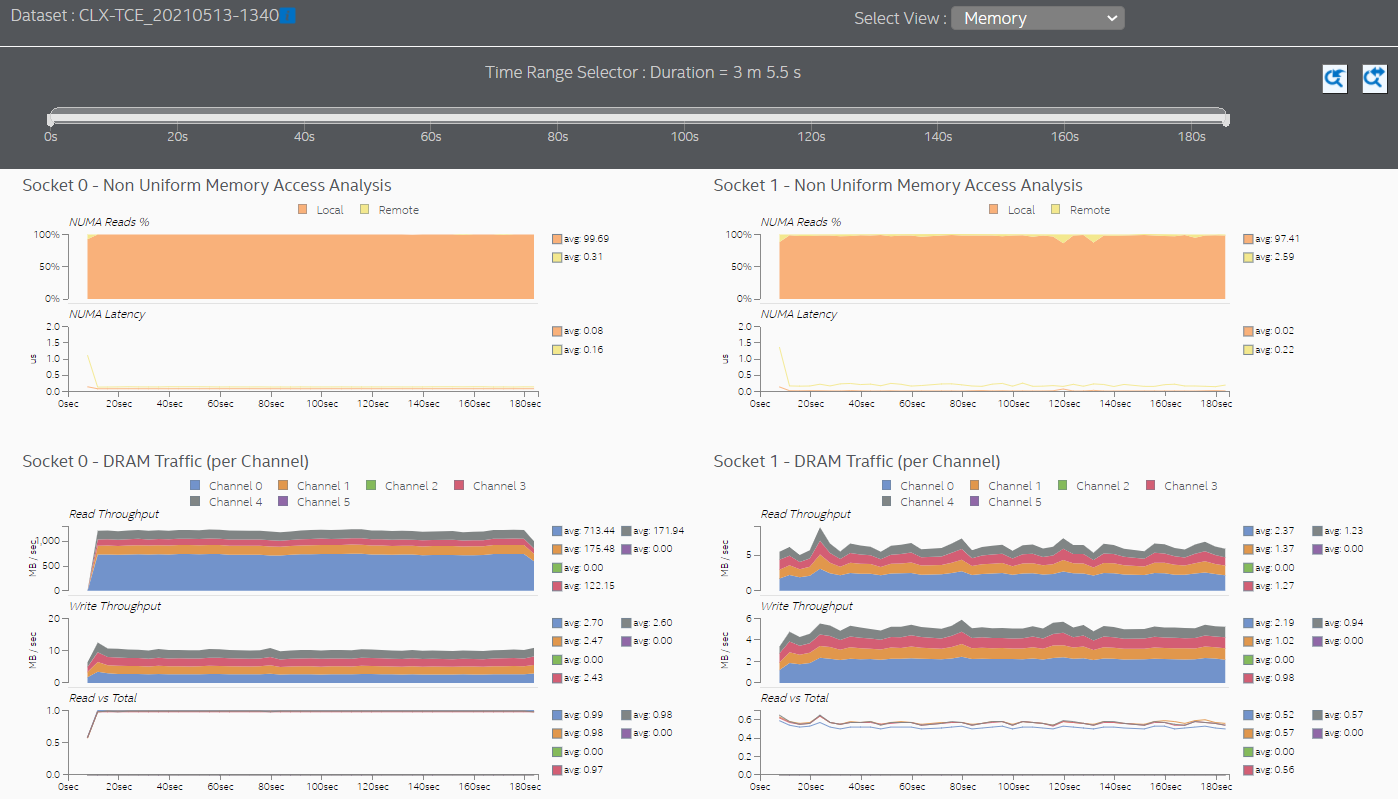
Switch to the Memory view to see additional information about memory accesses for each processor socket. In this sample application, both sockets initiate remote memory accesses.
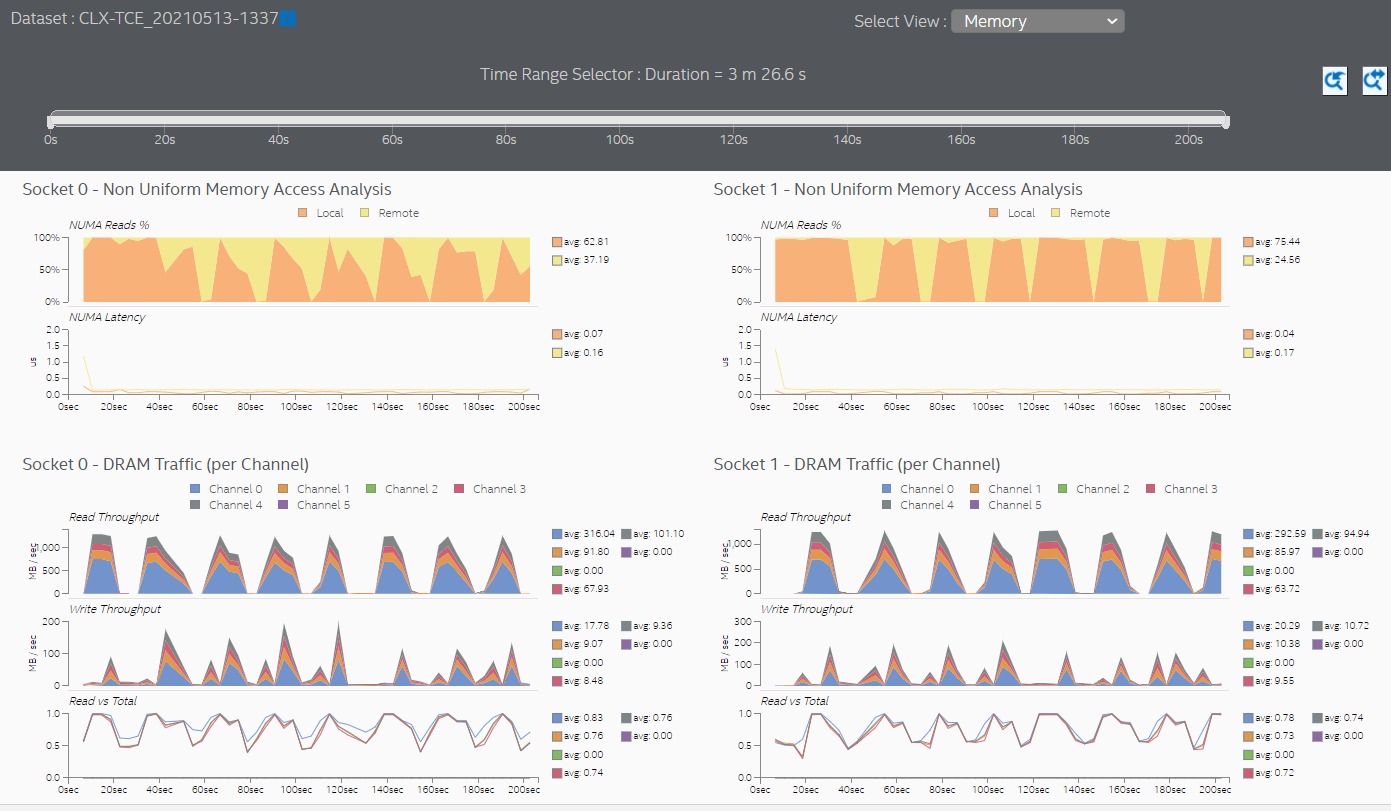
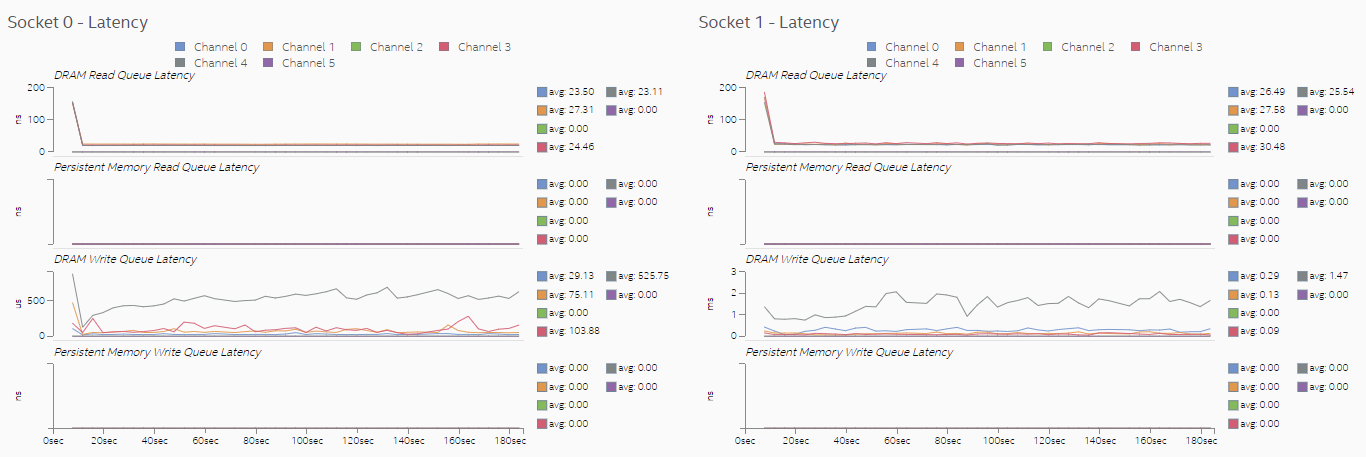
Latencies in memory accesses spike when the remote memory is accessed. These spikes indicate an opportunity for performance improvement.
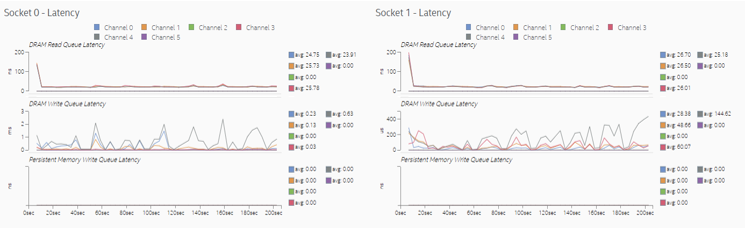
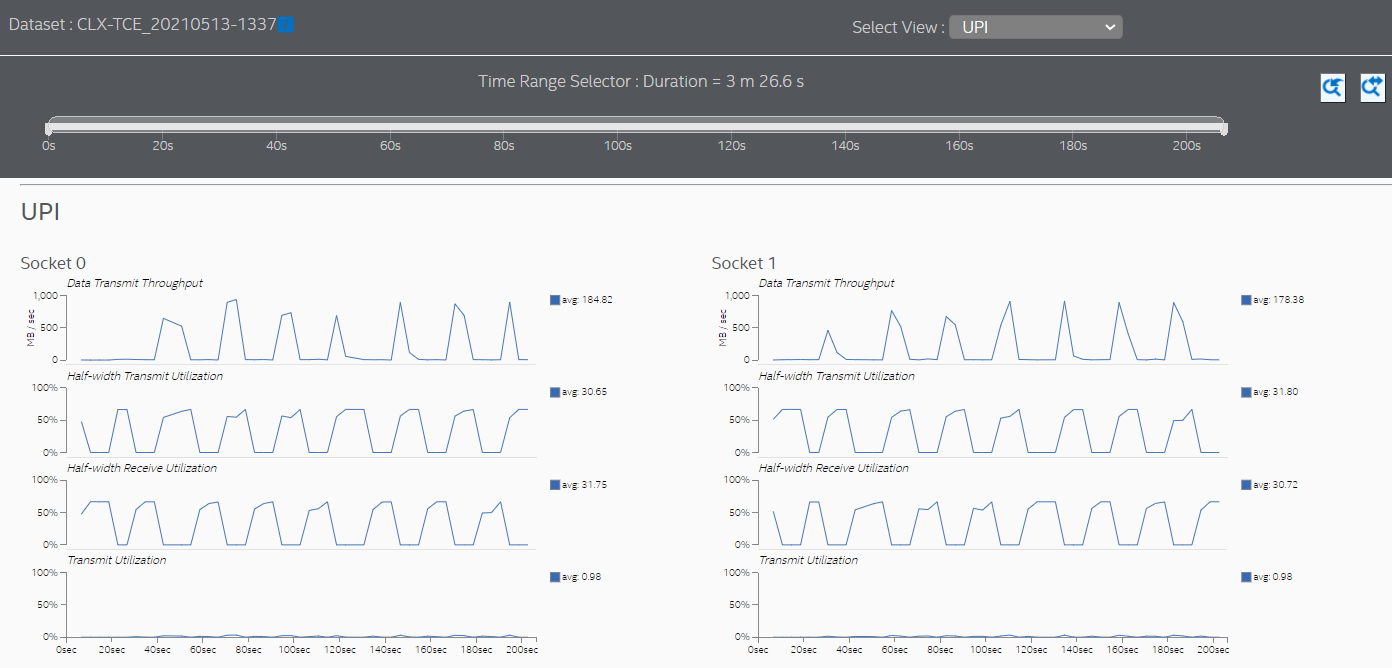
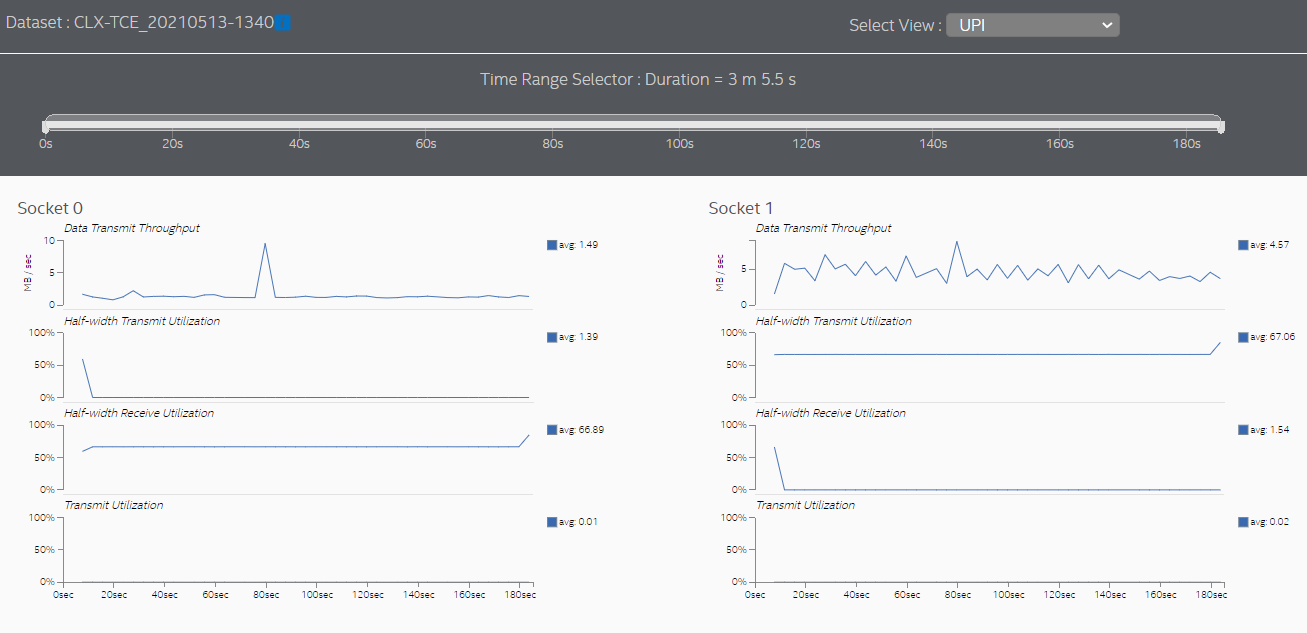
Switch to the UPI view to see the cross-socket traffic transmitted by each socket.
Set Thread CPU Affinity to Fix NUMA Issues
The sample application used in this recipe does not assign (or pin) software threads to specific sockets and cores. The absence of this assignment causes the operating system to periodically schedule threads on processor cores located in different sockets. In other words, the application is not 'NUMA-aware'. This condition results in frequent accesses to remote memory, which in turn result in high cross-socket traffic and higher memory access latencies.
One way to reduce remote memory accesses and cross-socket traffic is to assign the affinity of the processes which execute on the same memory ranges, to processor cores in the same socket. This assignment helps to maintain memory access locality. The programming guide for your operating system may recommend other approaches to reduce cross-socket traffic on NUMA systems.
Verify NUMA Optimizations
Once you have completed NUMA optimizations, run the Platform Profiler data collection again on the optimized code and import the results into the Platform Profiler server. The next graph shows memory accesses after assigning affinity to cores in socket 0.
In the sample used here, the results show that almost all memory accesses are now local accesses. Most cross-socket traffic spikes were eliminated.
The Memory view shows that both sockets are mostly accessing local memory.
Setting thread CPU affinity and completing optimizations helped reduce memory access latencies significantly because more memory requests were directed to local memory. Observe in the Memory view that the scale of the DRAM Write Queue Latency graph changed from micro-seconds to nanoseconds.
The UPI view also shows much lower cross-socket traffic.
You can discuss this recipe in the Analyzers community forum.