Analyzing Uncore Perfmon Events for Use of Intel® Data Direct I/O Technology in Intel® Xeon® Processors (NEW)
Use Intel® VTune™ Profiler to understand the utilization efficiency of Intel® Data Direct I/O (Intel® DDIO) technology, a hardware feature of Intel® Xeon® processors.
Content Experts: Alexander Antonov, Yu Zhang
When you profile software applications for performance, an uncore event refers to the functions of the CPU that operate outside the core. These functions can relate to the operations of:
- the memory controller
- the UPI block
- I/O stacks
You can use Intel VTune Profiler to monitor the count of uncore hardware performance events. Together with other performance metrics from analysis runs, this information can help you dive deep into PCIe traffic and behavior.
This recipe demonstrates how you use uncore events, related to PCIe, to analyze DDIO and VT-d efficiency. This recipe uses the Input and Output analysis type in Intel VTune Profiler.
The I/O metrics and events described in this recipe are based on the use of the Intel® Xeon® server platforms code named Ice Lake. Since there can be different uncore events per platform, there may be some differences for the same metric calculation.
Ingredients
Application: DPDK testpmd application
Analysis Tool:Intel® VTune™ Profiler version 2023.2 or newer (Input and Output analysis)
Platforms: Two Intel® Xeon® Platinum 8358 CPU @ 2.60GHz platforms connected through an Ethernet cable
Network Interface Card: Intel® Corporation Ethernet Controller X710 for 10GBASE-T
Operating System: Ubuntu 22.04.3 LTS
Run Input and Output Analysis
- Make sure to use 1st or higher generations of Intel® Xeon® Scalable processors.
- Check to confirm that the sampling driver is loaded.
- Plan to collect data for at least 20 seconds.
This procedure uses the Input and Output analysis in VTune Profiler to collect Intel DDIO utilization efficiency metrics. When you run the analysis in driverless mode, there may be some limitations.
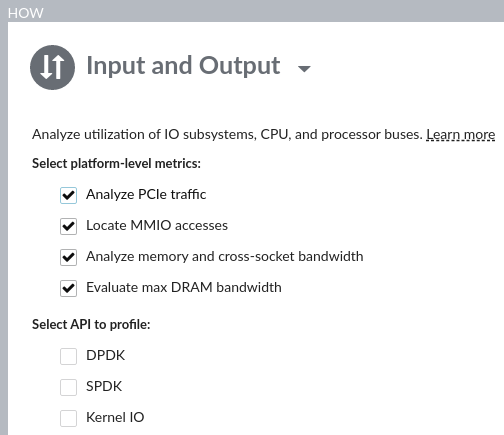
From the Analysis Tree in VTune Profiler, open the Input and Output analysis type.
In the WHAT pane, do one of the following:
- Select Launch Application and specify the path to the application and any parameters.
- Select Attach to Process and specify the PID
In the HOW pane, check the Analyze PCIe traffic checkbox to collect Intel DDIO utilization efficiency metrics.
Click the
 Start button to run the analysis.
To run this analysis on the dpdk-testpmd benchmark from the command line, type:
# vtune -collect io -knob iommu=true -- dpdk-testpmd -l 32-35 -n 8 -- --mbcache=0 –mbuf-size=65535 –total-num-mbufs=8192
Run this analysis on one of the available systems. On the other system, generate PCIe traffic:
# dpdk-testpmd -l 0-3 -- --forward-mode=txonly
Analyze Results
Once data collection is complete, download the results to your workstation. You can then open the results in the VTune Profiler GUI or VTune Profiler Web Server.
This recipe demonstrates the use of the latter.
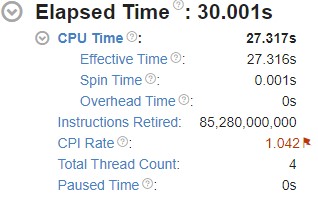
Start your examination of results in the Summary window, where you see a general overview of the execution of the application.
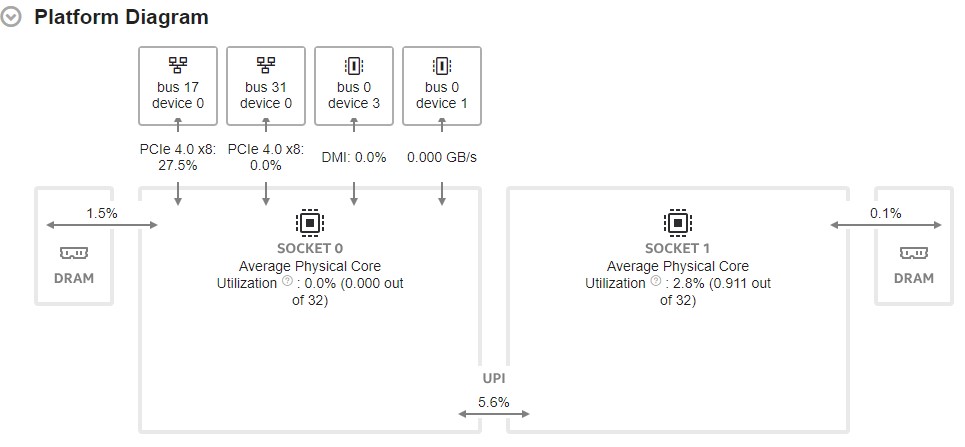
Next, look at the Platform Diagram. You see information about:
- System topology and physical core utilization
- Average DRAM use for each CPU socket package
- Average PCIe utilization for each PCIe device with known device capabilities. For unknown capabilities, the diagram displays the PCIe Average Bandwidth.
- Utilization metric for Intel® Ultra Path Interconnect (Intel UPI) cross-socket links
Let us now look at metrics in the PCIe Traffic Summary section:
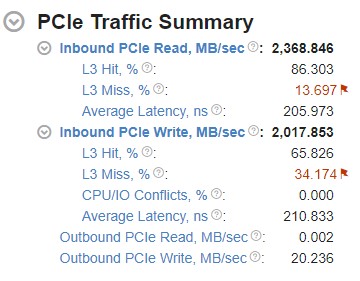
To understand how I/O traffic processes on the platform, look at the first level of PCIe bandwidth metrics.
PCIe traffic includes Inbound and Outbound traffic.
Inbound traffic: This type of traffic is initiated by I/O devices. These can be external or internal PCIe devices that read from or write to the system memory. Inbound traffic is processed through Intel Data Direct I/O (DDIO) Technology.
This technology can help improve the efficiency of I/O data processing for delivery and consumption of data from I/O devices. Instead of the DRAM, Intel® DDIO makes the L3 cache the primary destination and source of I/O data. By avoiding multiple read and write operations to the DRAM, Intel® DDIO achieves these benefits:
- Reduced inbound read and write latency
- Increased I/O bandwidth
- Reduced DRAM access
- Reduced power consumption
An Inbound Read operation has the I/O device reading from system memory.
An Inbound Write operation has the I/O device writing to the system memory.
Outbound traffic: This type of traffic is initiated by the CPU. These operations include reading from or writing to the memory or registers of I/O devices. Typically, the CPU accesses the device memory through the Memory-Mapped I/O (MMIO) space.
An Outbound Read operation has the CPU reading from I/O device registers.
An Outbound Write operation has the CPU writing to the I/O device registers.
The Integrated I/O (IIO) performance monitoring events are used to calculate PCIe bandwidth. IIO stacks manage traffic between the PCIe and Mesh domains. These tables list the set of uncore events that are used to count PCIe bandwidth by the channels (or parts) of the I/O stacks. The uncore events are mapped to the direction of the traffic which they count.
| Direction | Read Uncore Events | Description |
|---|---|---|
| Inbound | UNC_IIO_DATA_REQ_OF_CPU.MEM_READ.PART[0-7] |
Four bytes data request from system memory |
| Outbound | UNC_IIO_DATA_REQ_OF_CPU.CMPD.PART[0-7] |
I/O device sends completion to CPU four bytes request |
| Direction | Write Uncore Events | Description |
|---|---|---|
| Inbound | UNC_IIO_DATA_REQ_OF_CPU.MEM_WRITE.PART[0-7] |
Four bytes data request to system memory |
| Outbound | UNC_IIO_DATA_REQ_BY_CPU.MEM_WRITE.PART[0-7] |
Four bytes data requested by CPU |
To understand better the mapping of IIO performance events on the channels of I/O stacks, see the Uncore Performance Monitoring Reference Manual.
The events described in these tables increment once for every 4 bytes of data. To calculate the average PCIe bandwidth, multiply the event count by 4 and divide by the sample time.
Average PCIe Bandwidth (MB/s) = (Event count * 4 bytes / 10^6) / seconds sampled
When device capabilities are known and the maximum physical bandwidth can be calculated, the device link is attributed with the PCIe Effective Link Utilization metric. This metric is the ratio of bandwidth consumed on data transfers to the available physical bandwidth.
This metric does not account for protocol overhead (TLP headers, DLLPs, or physical encoding) and the metric reflects link utilization in terms of payloads. Thus, the PCIe Effective Link Utilization metric cannot reach 100%. However, this metric can inform about how far the link is from saturation. You can calculate the PCIe Effective Link Utilization metric this way:
PCIe Effective Utilization (%) = (Average PCIe Total Bandwidth (MB/s) / PCIe Max Bandwidth (MB/s)) * 100%
Average PCIe Total Bandwidth (MB/s) = (Average Inbound PCIe Bandwidth (MB/s) + Avg Outbound PCIe Bandwidth (MB/s))
Average Inbound/Outbound PCIe Bandwidth (MB/s) = (Average Read Bandwidth (MB/s) + Average Write Bandwidth (MS/s))
The calculation of PCIe Max Bandwidth is based on the max_link_width and max_link_speed sysfs attributes which are provided by the OS:
PCIe Max Bandwidth (MB/s) = Max Link Speed (GT/s per x1 link) * 1000 / 8 * Max Link Width * 2
The L3 Hit/Miss Ratios for Inbound I/O requests are the ratios of requests made by I/O devices to the system memory that hit or miss the L3 cache. To learn more about using Intel® DDIO efficiently, see Effective Utilization of Intel® Data Direct I/O Technology in the Intel® VTune™ Profiler Performance Analysis Cookbook.
The Caching/Home Agent (CHA) and Integrated I/O Ring Port (IRP) Performance Monitoring Events are used to calculate the L3 Hit/Miss ratios.
The CHA is a distributed agent that maintains memory coherence between core caches, IIO stacks, and sockets.
The IIO Ring Port (IRP) maintains coherency for IIO traffic that targets coherent memory.
The following table describes the events which are used to calculate these metrics.
| Traffic | Uncore Events | Alias | Description |
|---|---|---|---|
| Read | UNC_CHA_TOR_INSERTS.IO_MISS_PCIRDCUR | X | These are PCI Read Current (PCIRdCurs) requests issued by IO Devices that missed the LLC. These requests are full cache line read requests to get the most current data. |
| UNC_I_FAF_INSERTS | Y | These are inbound read requests to coherent memory. They are received by the IRP and inserted into the Fire and Forget (FAF) queue. |
|
| Write | UNC_CHA_TOR_INSERTS.IO_MISS_ITOM | A | These are Invalid to Modified (ItoM) requests issued by IO Devices that missed the LLC. ItoM is an ownership request without data, that is used for full cache line writes. |
| UNC_CHA_TOR_INSERTS.IO_MISS_ITOMCACHENEAR | B | The ItoMCacheNears indicates a partial write request from IO Devices that missed the LLC. |
|
| UNC_I_TRANSACTIONS.WR_PREF | C | These are Inbound write (fast path) requests to coherent memory, that are received by the IRP. These requests result in write ownership requests issued by IRP to the mesh. |
|
| UNC_I_MISC1.LOST_FWD | D | The snoop filter pulled away ownership before a write was committed |
The aliases listed in the table above represent the corresponding traffic in the formulae below.
| L3 Hit/Miss Ratios for Inbound PCIe Read Bandwidth | L3 Hit/Miss Ratios for Inbound PCIe Write Bandwidth |
|---|---|
| Inbound PCIe Read L3 Miss (%) = (X) / (Y)* 100% | Inbound PCIe Write L3 Miss (%) = ((A) + (B)) / ((C) + (D)) * 100% |
| Inbound PCIe Read L3 Hit (%) = 100% - Miss Ratio (%) | Inbound PCIe Write L3 Hit (%) = 100% - Miss Ratio (%) |
The Average Latency metric for Inbound Read/Write requests gives the average amount of time spent by the platform on processing inbound read/write requests for a single cache line. The calculation of this metric is based on Little’s Law:
Latency = Occupancy / Inserts
When the request is processed, a completion buffer holds items. Information about the occupancy of this buffer and the request arrival rate (inserts) enables the calculation of the average request processing time.
The table below describes uncore performance events which are used to calculate these metrics.
| Traffic | Uncore Events | Alias | Description |
|---|---|---|---|
| Read | UNC_IIO_COMP_BUF_OCCUPANCY.CMPD | X | PCIe Completion Buffer Occupancy |
| UNC_IIO_COMP_BUF_INSERTS.CMPD | Y | PCIe Completion Buffer Inserts of completions with data |
|
| Write | UNC_I_CACHE_TOTAL_OCCUPANCY.MEM | A | Total IRP occupancy of inbound read and write requests to coherent memory. |
| UNC_I_FAF_OCCUPANCY | B | Occupancy of the IRP FAF queue |
|
| UNC_I_TRANSACTIONS.WR_PREF | C | Inbound write (fast path) requests to coherent memory, received by the IRP resulting in write ownership requests issued by IRP to the mesh. |
The aliases listed in the table above represent the corresponding traffic in the formulae below.
| Inbound PCIe Read Latency (Ns) | Inbound PCIe Write Latency (Ns) |
|---|---|
| (X) / (Y) / IIO Frequency (GHz) | ((A) - (B)) / (C) / IRP Frequency (GHz) |
The CPU/IO Conflicts metric gives the ratio of Inbound I/O write requests that experienced contention for a cache line, between the IO controller and another agent on the CPU (like the core or another IO controller). These conflicts are caused by simultaneous access to the same cache line. Under certain conditions, these access attempts can cause the IO controller to lose ownership of the cache line. This forces the IO controller to reacquire the ownership of this cache line. Such issues can occur in applications that use the polling communication model, resulting in suboptimal throughput and latency.
The table below describes the uncore performance events which are used to calculate these metrics.
| Uncore Events | Alias | Description |
|---|---|---|
| UNC_I_MISC1.LOST_FWD | A | Snoop pulled away ownership before a write was committed |
| UNC_I_TRANSACTIONS.WR_PREF | B | The Inbound write (fast path) requests to coherent memory that were received by the IRP. These requests result in write ownership requests issued by IRP to the mesh. |
This formula is used to calculate the CPU/IO Conflicts metric:
Inbound PCIe Write CPU/IO Conflicts (%) = (A) / (B) * 100%
Intel® VT-d allows addresses in the incoming I/O device memory transactions to be remapped to different host addresses. To learn more about virtualization technology, see Intel® Virtualization Technology for Directed I/O Architecture Specification.
Intel VT-d enables the remapping of addresses for Inbound I/O requests. The Input and Output analysis type in Intel® VTune™ Profiler provides metrics related to Intel VT-d, that can help you analyze the efficiency with which workloads utilize Intel VT-d technology.
The IOMMU events from the IIO PMON block are used to calculate Intel VT-d metrics.
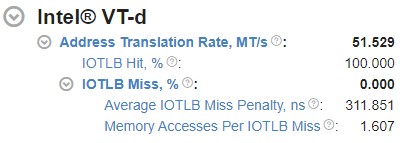
VT-d Address Translation Rate : This is the top level Intel VT-d metric. This metric shows the total amount of I/O Translation Lookaside Buffer (IOTLB) Lookups in millions of translations per second. The IOTLB is an address translation cache in the remapping hardware unit. IOTLB caches the effective translations from virtual addresses used by devices, to host physical addresses. IOTLB lookups happen on address translation requests. The UNC_IIO_IOMMU0.FIRST_LOOKUPS event (which counts the first time a request looks up IOTLB) is used to calculate the Address Translation Rate metric using the following formula:
Address Translation Rate (MT/s) = UNC_IIO_IOMMU0.FIRST_LOOKUPS / 10^6 / seconds sampled
IOTLB Hit/Miss Metrics : These metrics reflect the ratios of address translation requests that hit or miss the IOTLB. The UNC_IIO_IOMMU0.CTXT_CACHE_LOOKUPS uncore event is used to calculate the OTLB Miss ratio. This event counts each time a transaction looks up root context cache. The formulae for Hit/Miss ratios are:
IOTLB Miss (%) = UNC_IIO_IOMMU0.CTXT_CACHE_LOOKUPS / UNC_IIO_IOMMU0.FIRST_LOOKUPS * 100%
IOTLB Hit (%) = 100% - IOTLB Miss
For the group of IOTLB misses, there are two relevant metrics:
Average IOTLB Miss Penalty Metric : This metric shows the average amount of time spent on handling an IOTLB miss. This metric includes the time to look up the context cache, intermediate page table caches and page table reads (page walks) on a miss, which turn into memory read requests. The table below describes the uncore performance events which are used to calculate these metrics.
Uncore Events Alias Description UNC_IIO_PWT_OCCUPANCY A This event indicates the number of page walks that are outstanding at any point in time.
UNC_IIO_IOMMU0.CTXT_CACHE_LOOKUPS B This event counts each time a transaction looks up the root context cache.
Here is the formula used to calculate this metric:
Average IOTLB Miss Penalty (ns) = (A) / (B) / IIO Frequency (GHz)
Memory Access Per IOTLB Miss Metric : This metric shows the average number of memory read requests (page walks) per IOTLB miss. To calculate this metric, an additional event (UNC_IIO_TXN_REQ_OF_CPU.MEM_READ.IOMMU1) is used. This event counts the number of 64B cache line requests that were initiated by the I/O device, including reads and writes.
This metric is calculated by the following formula:
Memory Access Per IOTLB Miss = UNC_IIO_TXN_REQ_OF_CPU.MEM_READ.IOMMU1 / UNC_IIO_IOMMU0.CTXT_CACHE_LOOKUPS
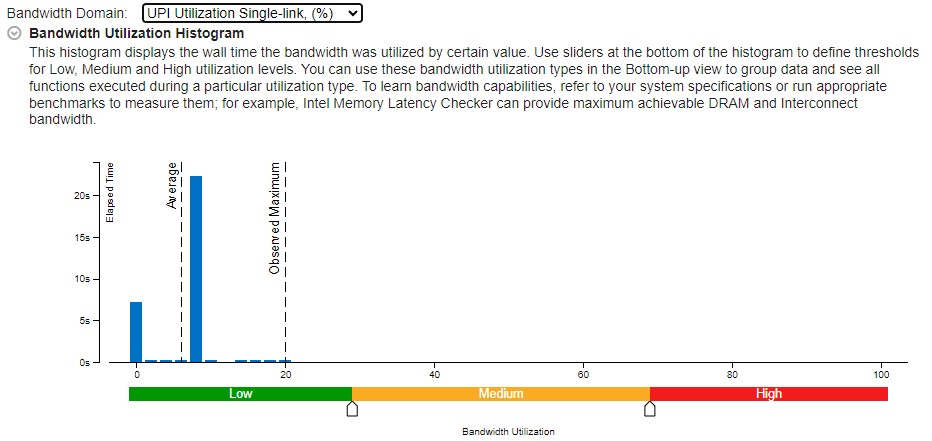
This histogram plots the system bandwidth (in this example, DRAM and UPI) used by a certain value on the X axis against time on the Y axis. The histogram provides thresholds to categorize bandwidth utilization as High, Medium, or Low. To set the threshold, move sliders at the bottom of the histogram. Here are examples for both bandwidth domains:
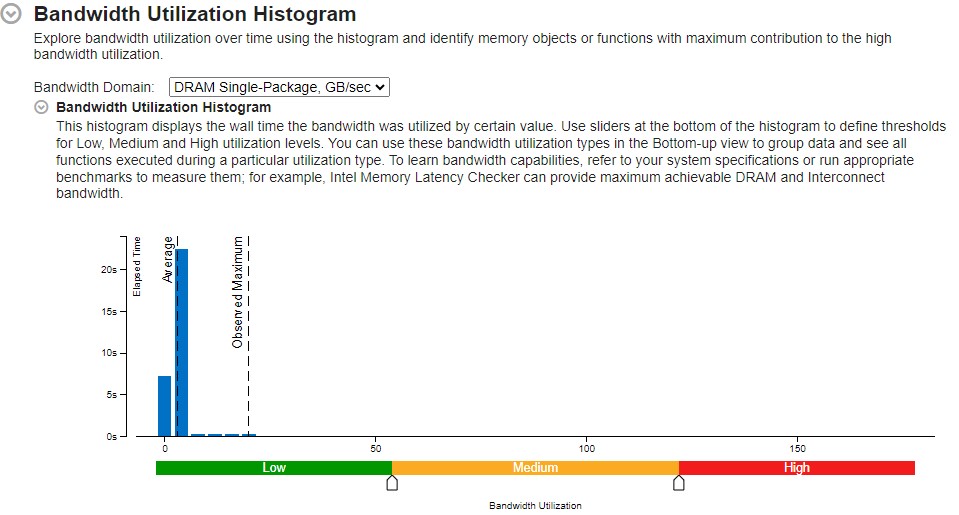
DRAM Bandwidth and Utilization:
UNC_M_CAS_COUNT.RD : This event counts the total number of DRAM Read Column Access Select (CAS) read commands on a per channel basis. CAS commands are issued to specify the address to read or write on the DRAM. This event increments for every 64 bytes. To calculate the total DRAM read data, use this formula:
Data Read (GB) = UNC_M_CAS_COUNT.RD * 64 (bytes) / 10^9
The average read bandwidth can be calculated by dividing on the sample time.
Average Read Bandwidth (GB/s) = Data Read (GB) / Global Elapsed Time (s)
UNC_M_CAS_COUNT.WR : This event counts the total number of DRAM Write CAS commands. This event increments for every 64 bytes. As for the read metric, the total DRAM write data is calculated this way:
Data Written (GB) = UNC_M_CAS_COUNT.WR * 64 (bytes) / 10^9
The average write bandwidth is calculated as:
Average Write Bandwidth (GB/s) = Data Written (GB) / Global Elapsed Time (s)
The DRAM average utilization can be calculated by dividing the average DRAM bandwidth by the maximum DRAM bandwidth. To calculate the maximum DRAM bandwidth, before you run the collection, select the Evaluate max DRAM bandwidth checkbox. A microbenchmark then starts before the collection to calculate the bandwidth.
DRAM Utilization (%) = Average DRAM Bandwidth (GB/s) / Max Local Bandwidth (GB/s) * 100%
Average DRAM Bandwidth (GB/s) = Average Write Bandwidth (GB/s) + Average Read Bandwidth (GB/s)
UPI Utilization:
The UNC_UPI_TxL_FLITS.ALL_DATA and UNC_UPI_TxL_FLITS.NON_DATA events indicate that valid flits sent for all data and non-data.
UPI Utilization (%) = (UNC_UPI_TxL_FLITS.ALL_DATA + UNC_UPI_TxL_FLITS.NON_DATA) / 3 / (UPI Active Clockticks * (5/6)) * 100%
UPI Active Clockticks = UNC_UPI_CLOCKTICKS – UNC_UPI_L1_POWER_CYCLES
Group Results into Views
The results of the Input and Output Analysis give us detailed information about I/O metrics. These metrics can be attributed to
- A group of PCIe devices
- PCIe metrics and performance uncore events
- I/O metrics over timeline
You can group these results in several views in these windows:
- Bottom-up window
- Uncore event count window
- Platform window
When you use the Package / IO Unit grouping in the Bottom-up window, you get a per-device breakdown for:
- Inbound and Outbound Traffic
- Inbound request L3 hits and misses
- Average latencies
- CPU/IO Conflicts
- VT-d metrics
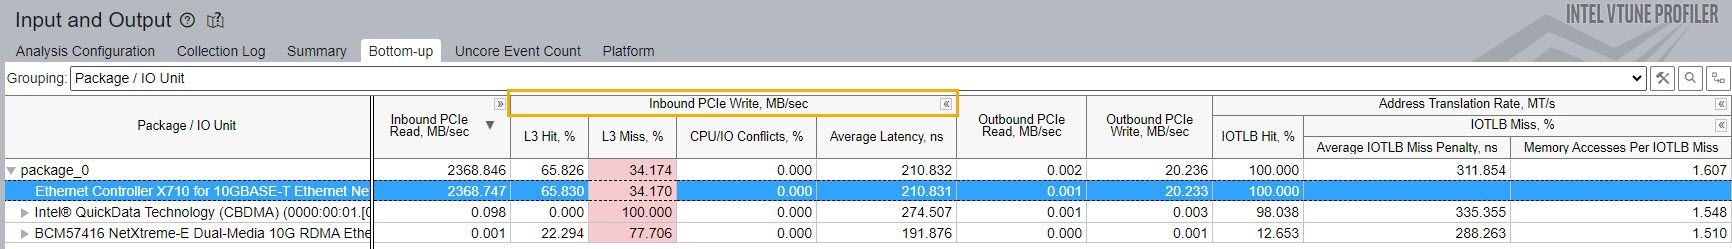
To show or hide second level metrics, adjust the display option in the Inbound PCIe Write table.
When use the Package / IO Unit grouping in the Uncore Event Count window, you can identify the count of uncore events per group of I/O device.
In this example, the Uncore Events section on the right contains performance events for the Ethernet Controller, which is the only device selected in the Package/IO Unit grouping.
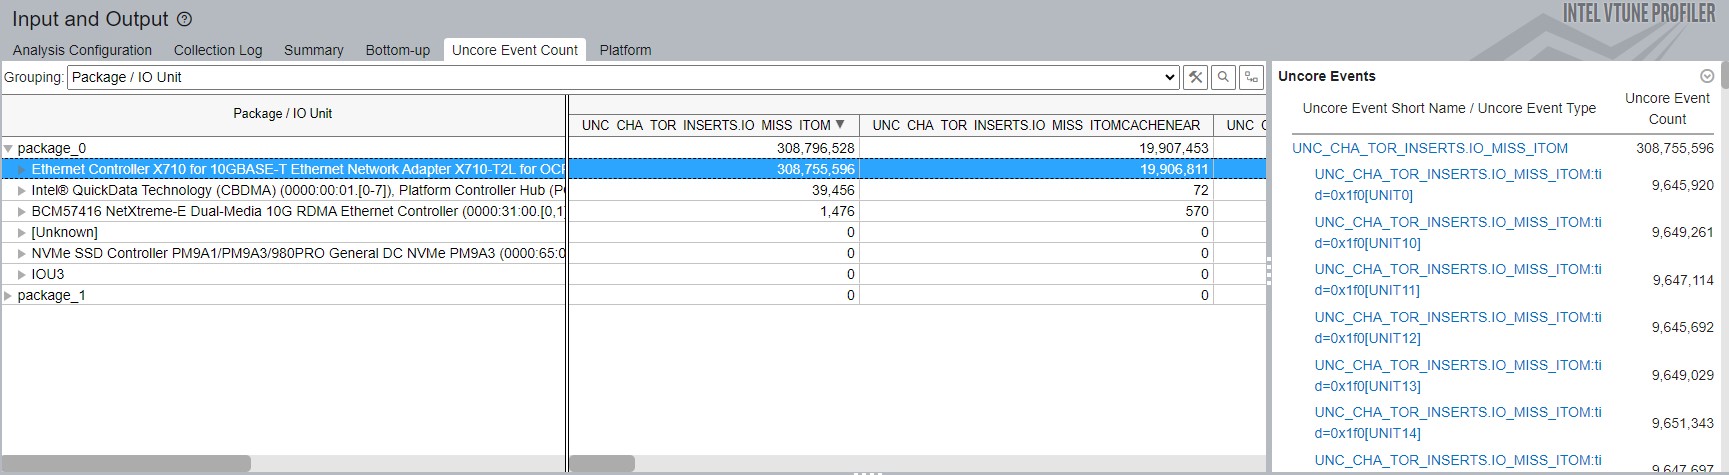
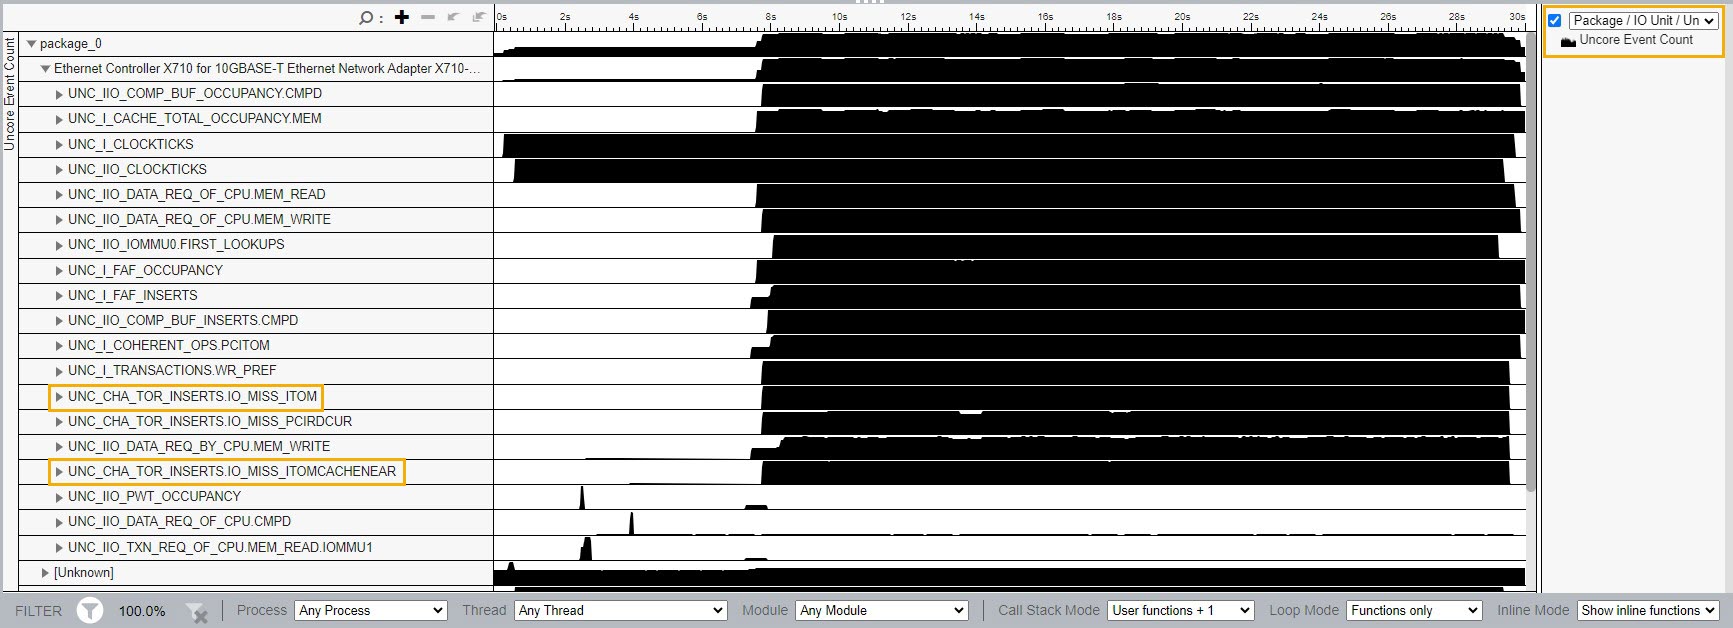
You can visualize all uncore events in the timeline section.
To see uncore events that are attributed a group of PCIe devices on each socket, in the right corner of the timeline section, select the Package/IO Unit/Uncore Event Short Name/Uncore Event Type grouping.
Use the formulae described earlier in this recipe to understand the behavior of I/O devices.
For example, the Inbound PCIe Write L3 Miss metric depends on the number of ItoM requests that missed the L3 cache. In the figure above, there are 2 ItoM requests that missed the L3 cache.
You can visualize with raw data over time. Increase these events to understand better the time when the overall PCIe performance can be impacted.
To see the exact amount of hardware events at a certain instant, hover your mouse over the timeline.
To take a closer look at suspicious values, select the region and right click to zoom or filter in.
The I/O events that cannot be attributed to I/O stacks, like IMC and UPI events, are displayed in the Unknown device group.
Using the Uncore Event Count window can be extremely helpful when you run Custom Analyses which use custom uncore events.
Use the Platform window to correlate PCIe traffic with the DRAM and UPI bandwidths. For example, when there is an L3 miss, data is read from the external DRAM.
Use the Package/Physical Core grouping in the Platform window to see the workload distribution on a core or thread. Use this information to further understand if there are issues related to NUMA.
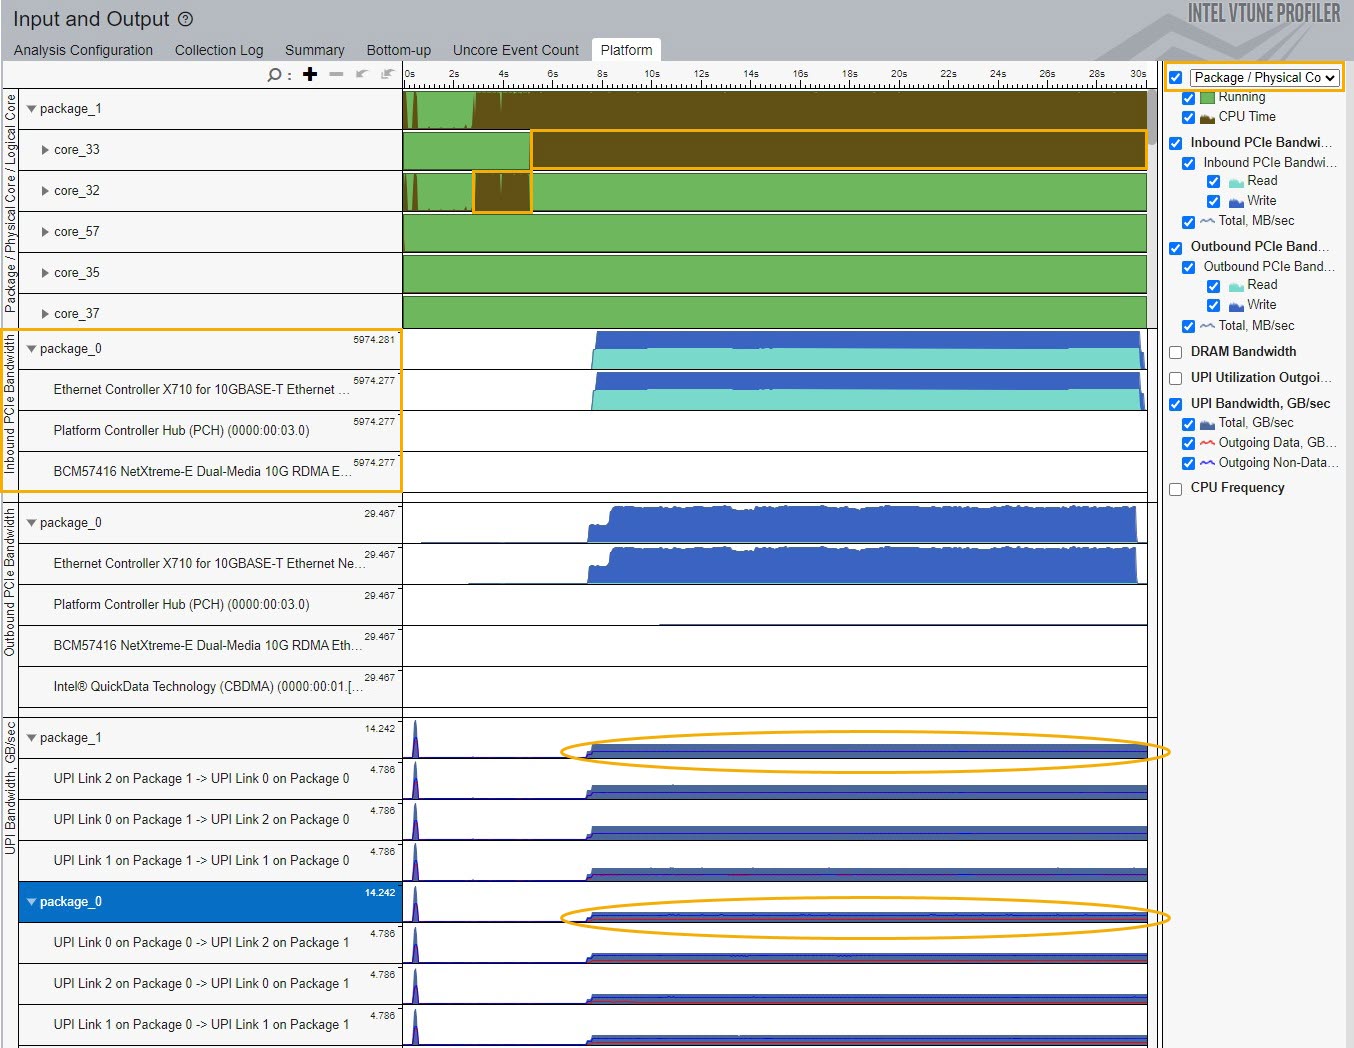
Use the UPI traffic information provided by UPI links to identify if I/O performance issues are likely caused by inefficient remote socket accesses.
In the example above, the worker cores were set on remote socket. Setting the worker cores on the same socket as the PCIe device can reduce UPI traffic as well as L3 miss values.
In turn, these reductions can improve the overall PCIe performance.
You can discuss this recipe in the Analyzers forum.