DPDK Event Device Profiling
Use Intel® VTune™ Profiler to analyze the efficiency of DPDK Event Device pipeline utilization in your DPDK-based application and identify issues, such as inhomogeneous load distribution and worker core underutilization.
Content Experts: Eugeny Parshutin, Jeffrey Reinemann
The Data Plane Development Kit (DPDK) is a framework that consists of libraries that accelerate packet processing workloads running on a wide variety of CPU architectures. One of these libraries is the eventdev library that enables you to improve system load balancing by using an event-based model in your application. An event-based approach suggests that the work that needs to be done by the system is presented as separate units called events. One common example of using the event-based programming model in DPDK is the network packet processing pipeline, where each packet plays the role of an event.
This figure gives an example of an eventdev pipeline configuration:
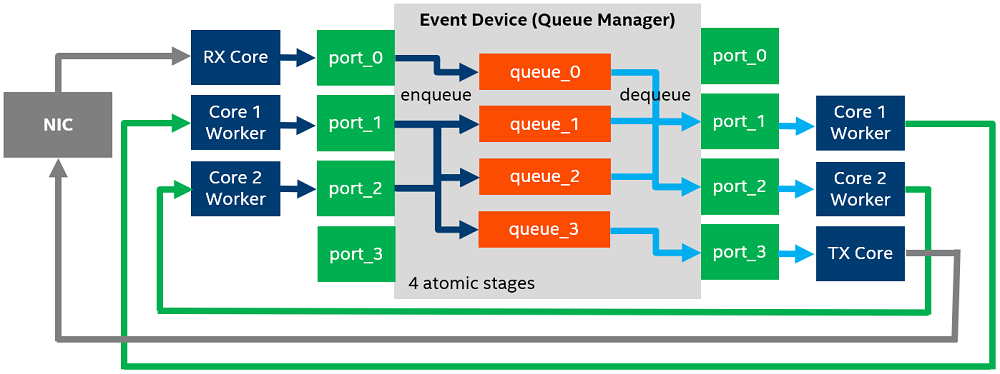
Here, each block represents the following unit:
Event Device – device with event scheduling capability, implemented either in hardware or software.
Queue – logical stage of the processing pipeline that contains events of different flows associated with scheduling types (atomic, ordered, or parallel).
Ports – points of contact between cores and the eventdev library that are used to enqueue and dequeue events to and from eventdev queues.
Worker Cores – CPU cores that are available to the application to perform work.
Rx Core – CPU core that receives packets from the NIC.
Tx Core – CPU core that transmits packets to the NIC.
NIC – Network Interface Card.
This example demonstrates an Event Device that is configured to manage four atomic stages that are presented as four event queues:
queue_0 is dedicated to keep newly arrived packets. Only the Rx core enqueues packets (events) to this queue.
queue_1 and queue_2 are dedicated to some type of event processing stage, such as setting destination address, cryptography processing, or compression. Worker cores perform these tasks and transfer packets between queues 0, 1, 2, and 3.
queue_3 is dedicated to keep packets that are ready to be transmitted. Only the Tx core dequeues packets from this queue.
The dequeue operation is performed using the rte_event_dequeue_burst() routine in an endless loop. Thus, worker cores continuously poll Event Device ports, looking for a batch of events to be processed. The batch size depends on overall load and performance of different stages. The maximum batch size is defined by the workload.
Per-worker dequeue statistics provided by Intel® VTune™ Profiler reveal the load balancing details and enable you to analyze pipeline configuration efficiency and identify pipeline bottlenecks.
This recipe defines the following steps to analyze the efficiency of the pipeline processing model in DPDK-based applications:
Ingredients
This section lists the hardware and software tools used in this performance analysis scenario:
- Application: the DPDK eventdev_pipeline application demonstrates the usage of the eventdev API and shows how an application can configure a pipeline and assign a set of worker cores to perform event processing. The application is compiled with DPDK with VTune Profiler support enabled.
- Tools:
- DPDK, compiled with VTune Profiler support enabled. To enable eventdev profiling on DPDK side, you need to apply a patch and recompile DPDK and the target DPDK application.
Use the following patches:
Intel® VTune™ Profiler (version 2024 or newer): Input and Output analysis
NOTE:Starting with the 2020 release, Intel® VTune™ Amplifier has been renamed to Intel® VTune™ Profiler.
Most recipes in the Intel® VTune™ Profiler Performance Analysis Cookbook are flexible. You can apply them to different versions of Intel® VTune™ Profiler. In some cases, minor adjustments may be required.
Get the latest version of Intel® VTune™ Profiler:
From the Intel® VTune™ Profiler product page.
Download the latest standalone package from the Intel® oneAPI standalone components page.
- DPDK, compiled with VTune Profiler support enabled. To enable eventdev profiling on DPDK side, you need to apply a patch and recompile DPDK and the target DPDK application.
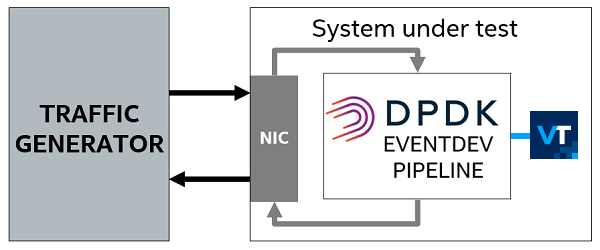
- System Setup:
- Traffic generator: a system that generates traffic for the system being tested.
- System under test: a system running the eventdev_pipeline application for packet (event) processing and VTune Profiler for performance data collection.
- CPU: Intel® Xeon® Platinum 8168 processor (formerly code named Skylake).
- Operating System: Linux* OS.
Run Input and Output Analysis
To collect DPDK eventdev dequeue statistics, run the Input and Output analysis in VTune Profiler.
Create a new project in VTune Profiler.
In the HOW pane, select Input and Output analysis
In Select API to profile, select DPDK
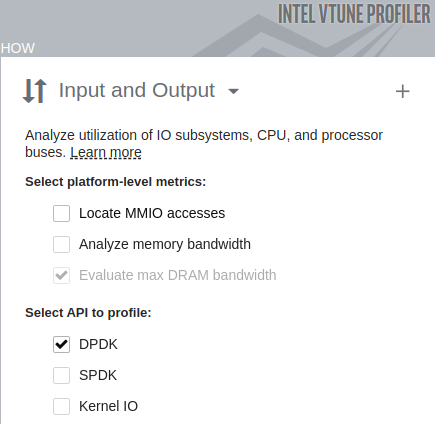
- Click the Start button.
Use this command:
vtune -collect io -knob kernel-stack=false -knob dpdk=true --target-process=eventdev_pipeline
Analyze Load per Stage
To get an overall characterization of DPDK eventdev pipeline utilization, start your investigation with the Summary tab and explore the DPDK Events Dequeue Statistics histogram:
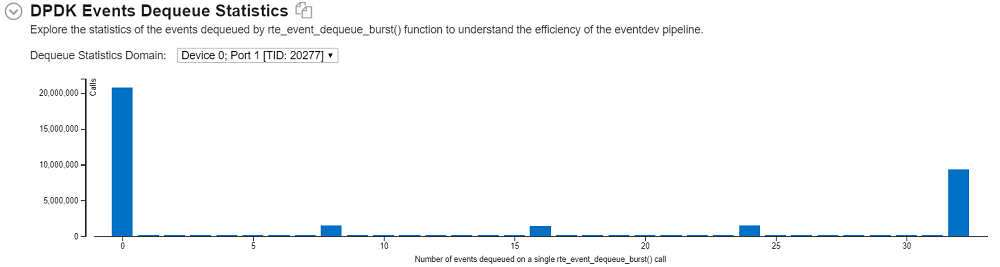
This histogram represents the statistics for the number of dequeued events for each eventdev port, that is, for each worker thread that polls the event device. Explore the different areas of the histogram to identify inhomogeneous load distribution, oversubscribed, or underutilized workers.
If you identify any imbalance in worker thread load distribution, try to reconfigure your pipeline to avoid this an re-run the analysis.
Analyze CPU Utilization
To understand the CPU utilization for workers performing event dequeue operations, navigate to the Platform tab and explore the DPDK Event Dequeue Spin Time overtime metric attributed to worker threads.
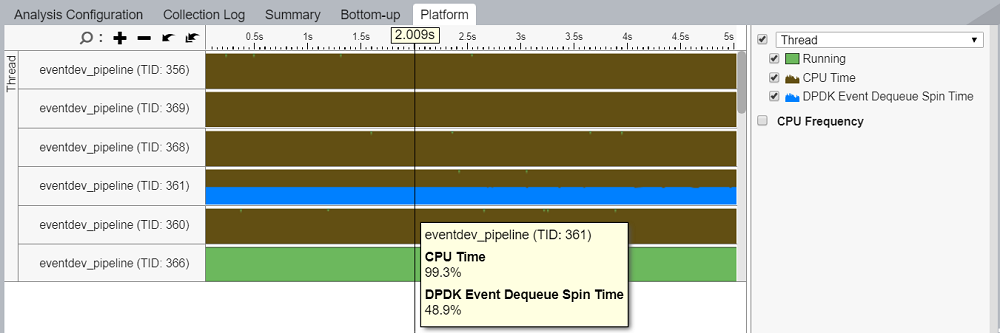
The DPDK Event Dequeue Spin Time per-thread metric shows the ratio of empty dequeue cycles, which is the ratio of rte_event_dequeue_burst() calls that returned zero events with respect to the total number of dequeue calls. Explore this metric to estimate worker thread load and to decide whether the application underutilizes cores or needs more resources.