Enabling Performance Profiling in GitLab* CI
This recipe helps you integrate Intel® VTune™ Profiler into your GitLab* CI pipeline to profile your builds on-the-fly.
This recipe demonstrates how you can enable unattended, automated profiling of your builds by including VTune Profiler into your GitLab Continuous Integration pipeline, and how to make access to the latest performance analysis data more convenient by using a static HTML feature of VTune Profiler.
See more integration examples for different Intel software products and CI systems in the oneapi-ci GitHub* repository.
This approach offers the following advantages:
Automatic performance analysis: If a performance regression was introduced into the build, setting up a test environment and collecting performance results manually can be monotonous and consumes valuable time of the engineers. Integration of VTune Profiler into the testing stage of your GitLab CI pipeline allows you to automatically collect performance data in a predetermined environment and to upload the results automatically as an artifact.
This eliminates manual work and lets you focus on determining the cause of the regression by making the performance results data readily available once the build is complete.
Customized configuration: The Command-Line Interface (CLI) capabilities of VTune Profiler allow for great flexibility in terms of CI integration. Using the CLI of VTune Profiler, you can set up a customized process that suits your team, for example, by selecting the necessary analysis types and parameters.
Some examples of possible configurations are:
Automatically run a basic Hotspots analysis for each build
Profile a new build only when a performance regression was detected at the load testing stage of your build system and collect performance data for all the necessary analysis types
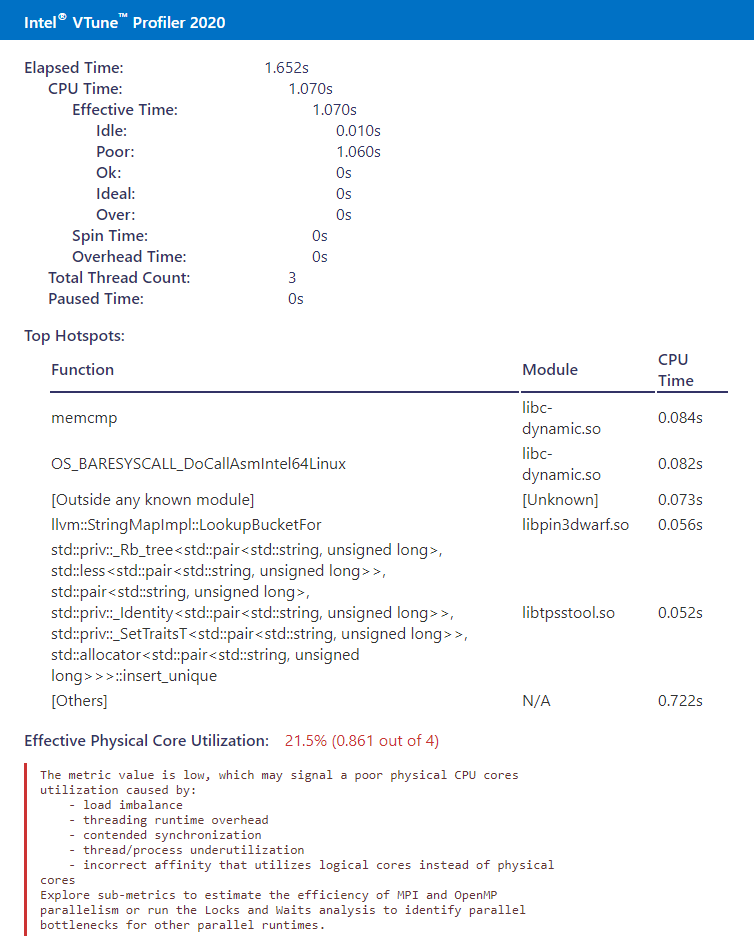
HTML analysis reports: VTune Profiler offers a command line option that generates a static HTML page with the summary for the collected result. This allows you to view the HTML page using your browser and to determine whether additional analysis is needed. Optionally, you can host these HTML reports as GitLab Pages for convenience.
- DIRECTIONS:
INGREDIENTS
This section lists the software tools used for the performance analysis scenario.
- Infrastructure: GitLab repository with a pre-configured GitLab CI pipeline, which includes:
Makefile for your project
Pre-populated .gitlab-ci.yml file
GitLab Runner with VTune Profiler installed
Tools: Intel® VTune™ Profiler 2020
NOTE:Starting with the 2020 release, Intel® VTune™ Amplifier has been renamed to Intel® VTune™ Profiler.
Most recipes in the Intel® VTune™ Profiler Performance Analysis Cookbook are flexible. You can apply them to different versions of Intel® VTune™ Profiler. In some cases, minor adjustments may be required.
Get the latest version of Intel® VTune™ Profiler:
From the Intel® VTune™ Profiler product page.
Download the latest standalone package from the Intel® oneAPI standalone components page.
Install GitLab Runner
If you do not have a configured GitLab Runner, to install and configure the GitLab Runner software package, follow the instructions provided in the official GitLab documentation available at https://docs.gitlab.com/runner/#install-gitlab-runner.
After installing GitLab Runner, install VTune Profiler using your preferred method. For instructions and available installation methods, see the VTune Profiler Install Guide.
Make sure to set /proc/sys/kernel/perf_event_paranoid to 0 to allow hardware event-based sampling collection without root privileges. For more information on profiling without Intel sampling drivers or root privileges, see the Profiling Hardware Without Intel Sampling Drivers Cookbook recipe.
- The performance analysis result may vary depending on the Runner selection and the individual machine running the analysis.
Configure Automatic Data Collection
Add the vtune command calls and the artifact handling commands to your GitLab pipeline. For example, you can add the following command to your .gitlab-ci.yml file:
vtune -collect hotspots ./<your_application>
This command launches the application specified by the last command option and collects Hotspots analysis data. It also stores the results data in a separate directory.
You can upload any combination of VTune Profiler results and summary HTML pages. For example, you can upload the full analysis result and the static HTML summary page for a quick overview of the performance of your application.
To generate a static HTML page, include the following command:
vtune -report summary -format=html > hotspots_summary.html
To upload the full VTune Profiler result as an artifact, it is necessary to package the result directory with your tool of choice. For example, to package the result data with tar:
tar -c r00* > vtune_result.tar
Using the vtune command, you can specify any options and select any analysis types that are valid for your environment. For more information on how to run an analysis from the command line, see the Run Command Line Analysis page of the online User Guide.
The graphical user interface of VTune Profiler offers a Command Line Configuration Generation feature, which allows you to conveniently pre-configure an analysis in the GUI and to instantly generate and copy a command that includes all the options and parameters that are necessary for your preferred analysis configuration. You can use this feature to quickly generate a command for later use.
For more information on manually creating a vtune command, see the Command Line Interface chapter of the online User Guide.
You may encounter limitations regarding the type of analysis you can run in a certain environment. For example, the Microarchitecture Exploration analysis type is not available under certain virtual machine hypervisors.
Configure an Automatic Upload of your Results as Artifacts
Add the files that you wish to upload to the artifacts/paths: section of your .gitlab-ci.yml file. For example, to upload both the HTML summary and a .tar file with the result directory:
artifacts:
	paths:
		- <relative-path-to-project>/vtune_result.tar
		- <relative-path-to-project>/hotspots_summary.html
Make sure to upload your result as a GitLab artifact. Otherwise, the results are still saved on the machine running VTune Profiler, but you will have to retrieve them manually.
View the Results Data
Once a build is complete, you can use the GitLab web interface to quickly access the analysis summary page. To do this:
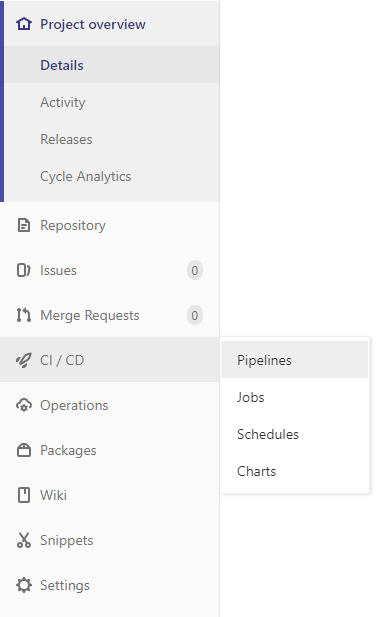
On GitLab, navigate to the Pipelines page.
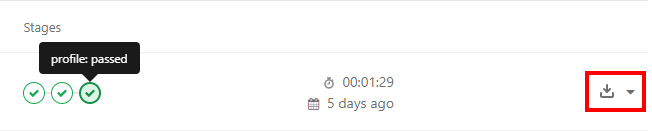
From this page, you can either download the entire artifact bundle, or browse to the HTML page separately and determine whether downloading the precollected result is necessary based on the summary.
To download the HTML page separately:
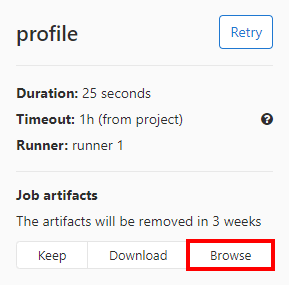
Navigate to the pipeline stage report page and click Browse.
Navigate to the location of the HTML page and download it.
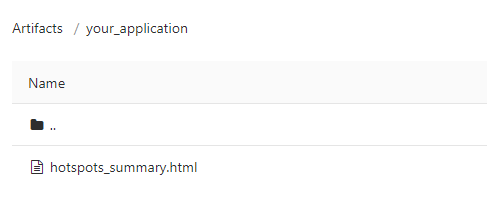
Open the summary HTML in your browser of choice and determine whether additional analysis is needed.
To view the results data using the graphical user interface of VTune Profiler:
Extract the results files from the .tar archives.
Launch the VTune Profiler GUI.
Click the
 Open Result button and browse to the result file. The result data will open in a new tab.
(Optional) Resolve Newly Introduced Issues
If you detect a performance regression, you can use other analysis types offered by VTune Profiler to help you identify and resolve the issues.
To discuss this recipe, visit the VTune Profiler developer forum.