Profiling Single-Node Kubernetes* Applications (NEW)
Learn how to use Intel® VTune™ Profiler to profile Kubernetes* applications deployed in single-node environments.
Content Expert: Alexey Kireev
Kubernetes* applications are popularly deployed in multi-node environments, where aspects like scalability and durability are important advantages. However there are other advantages when you deploy Kubernetes applications in single-node environments. You can expect a better experience in terms of deployment and management of containerized workloads, in addition to standard containerization features. You can use VTune Profiler to profile Kubernetes* applications in single-node environments and Kubernetes pods with multiple containers running simultaneously.
Follow this recipe to configure a single Kubernetes node and use VTune Profiler to analyze one or more pods running Docker* containers. This recipe employs the Java* code analysis capabilities of VTune Profiler.
Ingredients
Here are the hardware and software tools you need for this recipe:
Application:
- MatrixMultiplication - This is a Java application that is used as a demo. This application is not available for download.
- vtunedemo_fork - This is a native application that is used as a demoThe application may not be available for download.
Tools: VTune Profiler 2023 (or newer) - Hotspots analysis with Hardware Event-Based Sampling.
Container Orchestration System: Kubernetes
Operating system: Ubuntu* 22.04 based on Linux* kernel version 5.15 or newer
CPU: Intel® microarchitecture code named Skylake or newer architecture
Configure a Kubernetes Pod
Prerequisite: Install a Kubernetes pod. Follow instructions at http://kubernetes.io.
Once you have a Kubernetes pod ready,
Modify the YAML configuration file for the pod. This example uses pod-test as the pod name and test.yaml for the configuration file.
apiVersion: v1
kind: Pod
metadata:
  name: pod-test
  labels:
    app: pod-test
spec:
  containers:
  - name: pod-test-1
Enable a shared path between the host machine and the pod.
spec: volumes: - name: shared-path hostPath: path: /tmp/shared_path type: Directory containers: - name: pod-test-1 volumeMounts: - name: shared-path mountPath: /tmp/test_applicationwhere:- /tmp/shared_path is a directory located on the host side
- /tmp/test_application is a path located inside the pod
Configure the security context for the container. Enable privileged mode when profiling running pods. Type:
spec:
  containers:
    securityContext:
      privileged: true
In order to profile the system with workloads running in pods, you must give access to the host PID namespace:spec: hostPID: true
Apply the Kubernetes pod configuration file:
host> kubectl apply -f test.yaml
Run Hardware Event-Based Hotspots Analysis with VTune Profiler and Target in the Same Pod
In this procedure, let us run VTune Profiler and the workload in the same Kubernetes pod. We will then analyze the collected results on the host machine.
Prerequisite: Install VTune Profilersampling drivers for Linux targets or enable driverless collection.
Enable a shared path with VTune Profiler and the results directory between the node and the pod.
spec: volumes: - name: vtune-path hostPath: path: /opt/intel/oneapi/vtune type: Directory - name: vtune-results-path hostPath: path: /opt/vtune_results type: Directory containers: - name: pod-test-1 volumeMounts: - name: vtune-path mountPath: /vtune - name: vtune-results-path mountPath: /tmp/vtune_resultswhere:- /opt/intel/oneapi/vtune is the path to the installation directory (on the host) for VTune Profiler
- /vtune is a VTune Profiler path located inside the pod
- /opt/vtune_results is a writable location for VTune Profiler results on the host
- /tmp/vtune_results is a path to VTune Profiler results in the pod
Run Hotspots analysis in Launch Application mode. Use analyze_mod path in the results directory.
pod> cd /vtune/latest pod> source vtune-vars.sh pod> vtune -collect hotspots -knob sampling-mode=hw -knob enable-stack-collection=true --app-working-dir=/var/local/jdk-19.0.2/bin -result-dir=/tmp/vtune_results/analyze_pod/r@@@{at} --duration 30 -- /var/local/jdk-19.0.2/bin/java -cp /tmp/test_application/java_tests/MatrixMultip_32bit/ MatrixMultiplicationNOTE:You can run User-mode and Hardware Event-based Hotspots analysis in both Launch Application and Attach to Process modes within the pod.When the data collection completes, open the GUI on the VTune Profiler host machine.
host> vtune-gui
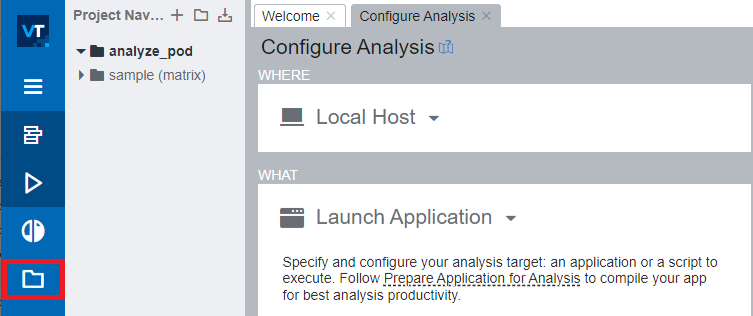
Create a project for the collected results. Let us call it analyze_pod.
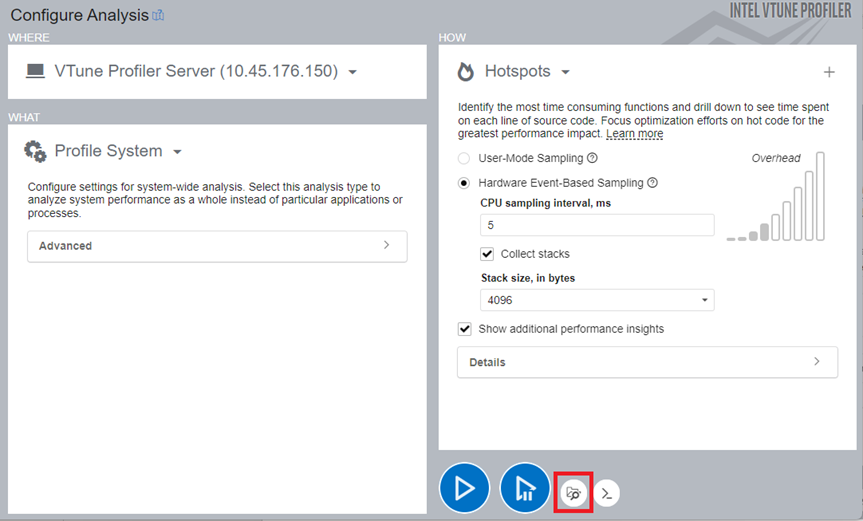
Open the collected results. Click on the icon highlighted here:
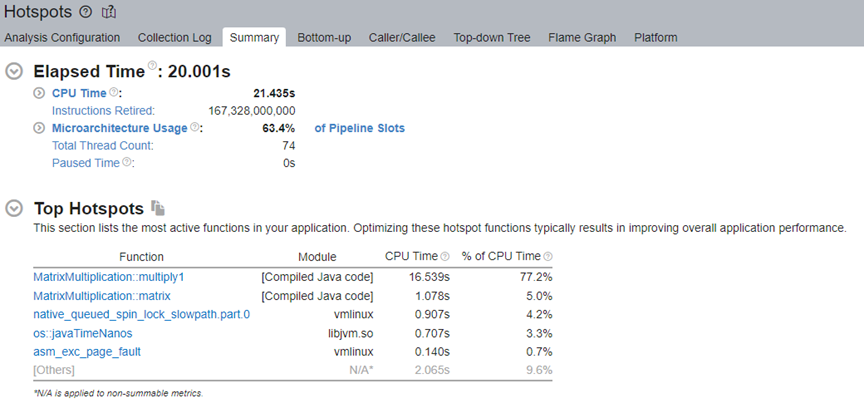
Review the results in the Summary window of the Hotspots Analysis.
Run Hotspots Analysis in User-Mode Sampling on a Pod Target
Use VTune Profiler on the host machine to run a Hotspots analysis on a target in a Kubernetes pod.
Start VTune Profiler Server on the host machine. Type:
host> cd /opt/intel/oneapi/vtune/latest
host> source vtune-vars.sh
host> vtune-backend --allow-remote-access --web-port=50777 --enable-server-profiling &
where:- --allow-remote-access enables remote access
- --web-port=50777 is the HTTP/HTTPS port for web UI and data APIs
- --enable-server-profiling enables the user to select the hosting server as the profiling target
- & runs the command in the background
The vtune-backend command returns a URL which you can open outside the container. For example:
Serving GUI at https://10.45.176.150:50777/?one-time-token=0ee4ec13b6c33fe416b49fcb273d43ac
Run the native application in the pod.
pod> /tmp/test_application/native_app
pod> ./vtunedemo_fork -nonstop -nt 80
Run vtune-backend and open the URL you receive.
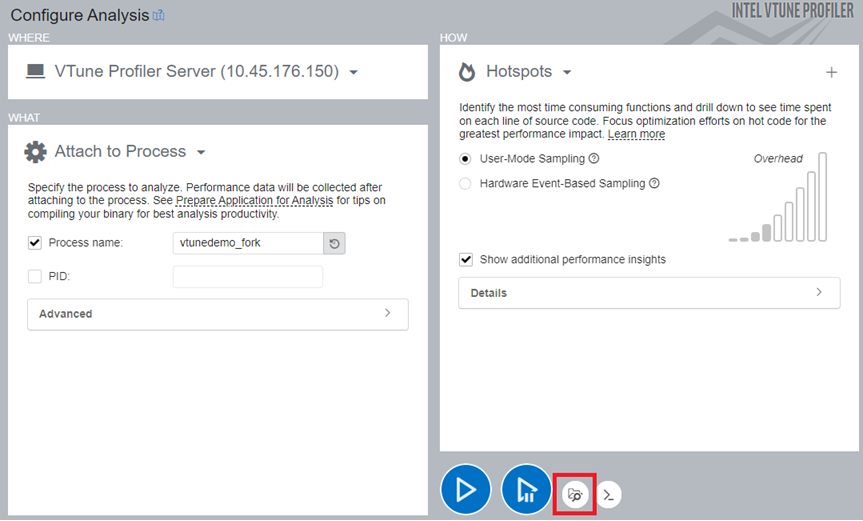
Create a project, for example kubernetes_pod.
To analyze the application running within the pod, run the Hotspots analysis in User-mode or Hardware Event-based Sampling mode. However, you must first configure the analysis to attach to the process. Specify the binaries and symbols of the application for Function level and Source level analysis of collected data:
 NOTE:The file locations must be from the host.
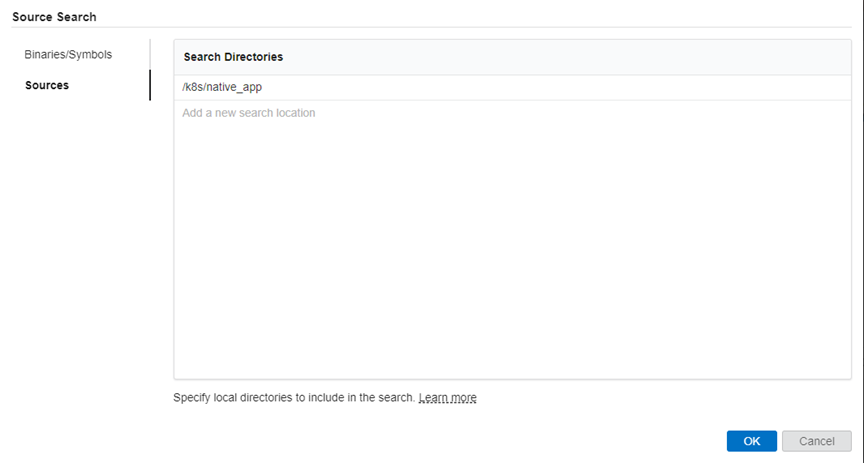
Once the analysis completes, VTune Profiler displays results in the Summary window.
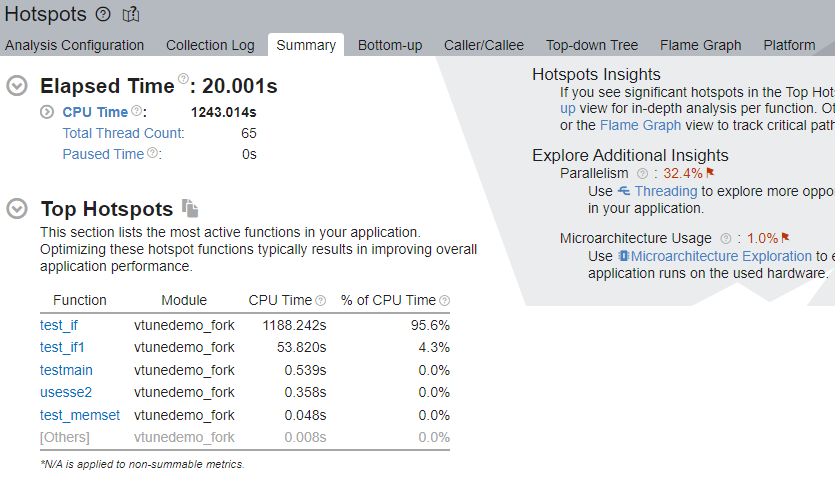
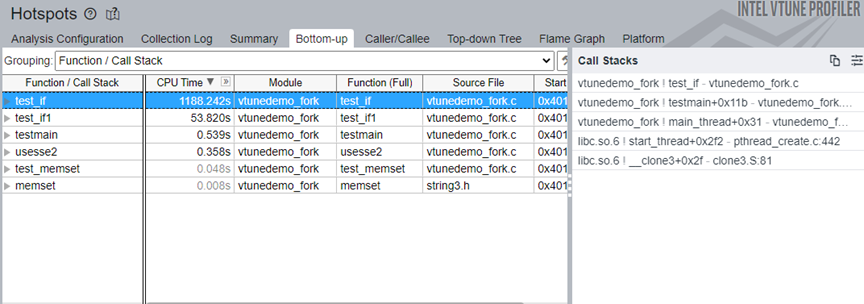
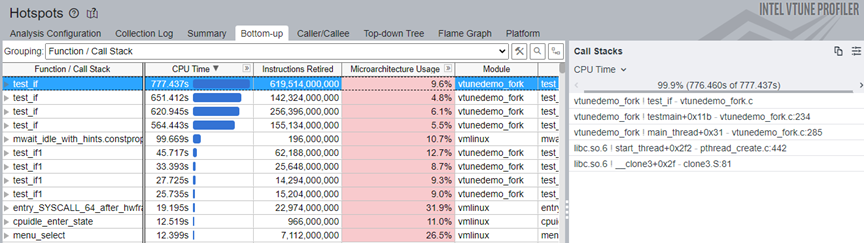
In the Top Hotspots section, we see that the test_if function of the target application consumed the most CPU time. Click on this function and switch to the Bottom-up window. See the stack flow for this hotspot.
- You can only profile native C/C++ applications.
- You cannot profile applications that are instrumented with Intel® Instrumentation and Tracing Technology (ITT) APIs/JIT APIs and are running inside the container.
Run Profile System Analysis for Pods with Multiple Containers
Let us now run VTune Profiler on the host machine to profile a system with a Kubernetes pod that contains multiple containers.
Prerequisites:
Install VTune Profilersampling drivers for Linux targets or enable driverless collection.
To profile multiple containers inside a pod, each container must contain privileged:true in the securityContext section.
Start VTune Profiler Server on the host machine.
host> cd /opt/intel/oneapi/vtune/latest
host> source vtune-vars.sh
host> vtune-backend --allow-remote-access --web-port=50777 --enable-server-profiling &
where:
--allow-remote-access enables remote access
--web-port=50777 sets the HTTP/HTTPS port for web UI and data APIs
- --enable-server-profiling enables the user to select the hosting server as the profiling target
- & runs the command in the background
Run vtune-backend. This command returns a URL which you can open outside the container. For example:
Serving GUI at https://10.45.176.150:50777/?one-time-token=0ee4ec13b6c33fe416b49fcb273d43ac
Open the URL you receive.On the host machine, start the Profile System analysis. Specify the binaries and symbols of the application for Function and Source level analysis of collected data.
 NOTE:The file locations must be from the host.
Inside the containers, run native applications.
Once the analysis completes, see results in the Summary tab.
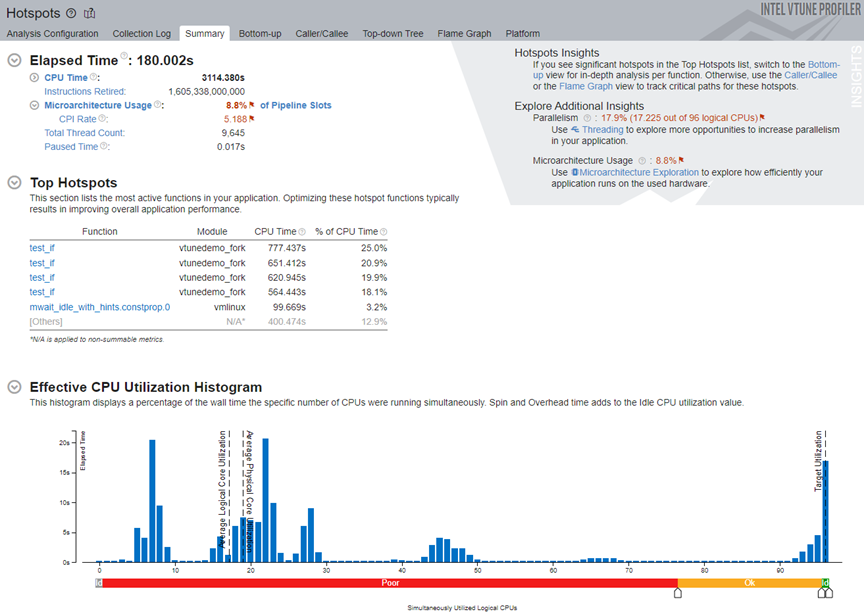
In the Top Hotspots section, click on the test_if function and switch to the Bottom-up window. See the stack flow for this hotspot.
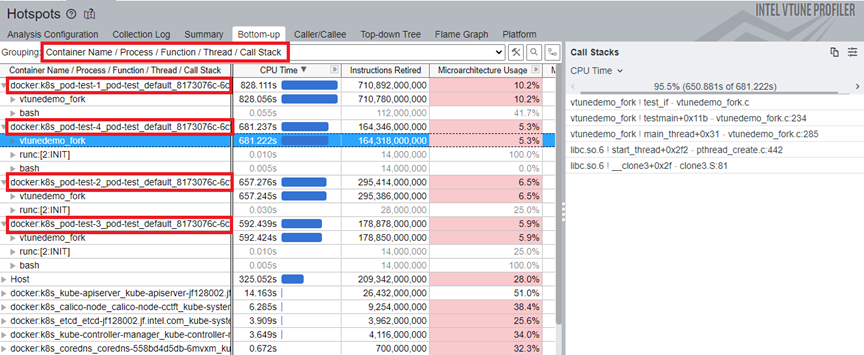
To see performance data for the containers of the individual pod, select the Container Name/Process/Function/Thread/Call Stack grouping from the pull down menu. Identify containers by the docker:k8s prefix.
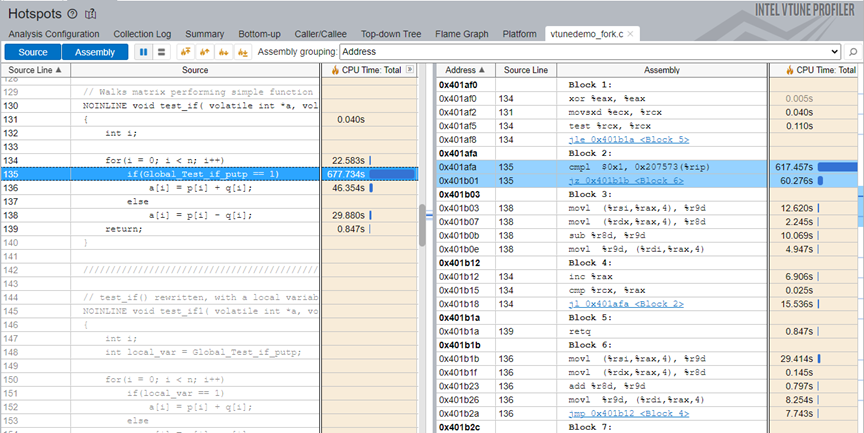
Double click on the test_if function to do a source level analysis for this function.
You can only profile native C/C++ applications.
You cannot profile applications instrumented with ITT/JIT API.