Profiling an Application for Performance Anomalies (NEW)
This recipe describes how you can use the Anomaly Detection analysis type in Intel® VTune™ Profiler to identify performance anomalies that could result from several factors. The recipe also includes some suggestions to help you fix these anomalies.
A performance anomaly is a sporadic issue that can cause irreparable loss when ignored. There can be several types of performance anomalies that can cause unwanted behavior including:
- Slow/skipped video frames
- Failure in tracking images
- Unexpectedly long financial transactions
- Long processing times for network packets
- Lost network packets
While these behaviors are not visible to traditional sampling-based methods, you can use the Anomaly Detection analysis type to locate them instead. Use this analysis to examine anomalies caused by:.
- Deviations in control flow
- Thread context switches
- Unexpected kernel activity (like interrupts or page faults)
- Drops in CPU frequency
Anomaly Detection is based on Intel® Processor Trace (Intel PT) technology. It provides granular information from the processor at the nanosecond level.
Ingredients
Here are the minimum hardware and software requirements for this performance analysis.
Application: Use a sample application of your choice.
Microarchitecture: Intel® Xeon® processor code named Skylake or newer.
Tools: Anomaly Detection Analysis, available in Intel® VTune™ Profiler version 2021 or newer.
NOTE:Starting with the 2020 release, Intel® VTune™ Amplifier has been renamed to Intel® VTune™ Profiler.
Most recipes in the Intel® VTune™ Profiler Performance Analysis Cookbook are flexible. You can apply them to different versions of Intel® VTune™ Profiler. In some cases, minor adjustments may be required.
Get the latest version of Intel® VTune™ Profiler:
From the Intel® VTune™ Profiler product page.
Download the latest standalone package from the Intel® oneAPI standalone components page.
Operating system:
Linux* OS, Fedora 31(Workstation edition) - 64 bit version
Windows* 10 OS
- Operating system: Any version of Windows* OS or Linux* OS
- Microarchitecture: Intel processor code named Skylake or newer
Prepare Application for Analysis
Typically in software performance analysis, you collect massive sets of data. Since performance anomalies are rare and short-lived, they take up only a fraction of these data sets and thus can go easily unnoticed. A better approach is to focus the analysis on a specific code region. You can do this with the Intel® Instrumentation and Tracing Technology (ITT) API.
Prepare your application by selecting a code region:
- Go to the directory that contains the sample application.
- Register a name for the code region you want to profile.
__itt_pt_region region=__itt_pt_region_create("region of interest"); - In the sample, find a loop that performs operations which are susceptible to anomalies. Use begin and end functions to mark iterations of that loop. For example:
double process(std::vector<double> &cache)
{
   double res=0;
   for (size_t i=0; i<ITERATIONS; i++)
   {
     __itt_mark_pt_region_begin(region);
     res+=calculate(i, cache);
     __itt_mark_pt_region_end(region);
   }
return res;
}
Run Anomaly Detection
On the Welcome screen, click Configure Analysis.
In the Analysis Tree, select the Anomaly Detection analysis type in the Algorithm group.
In the WHAT pane, specify your application and any relevant application parameters.
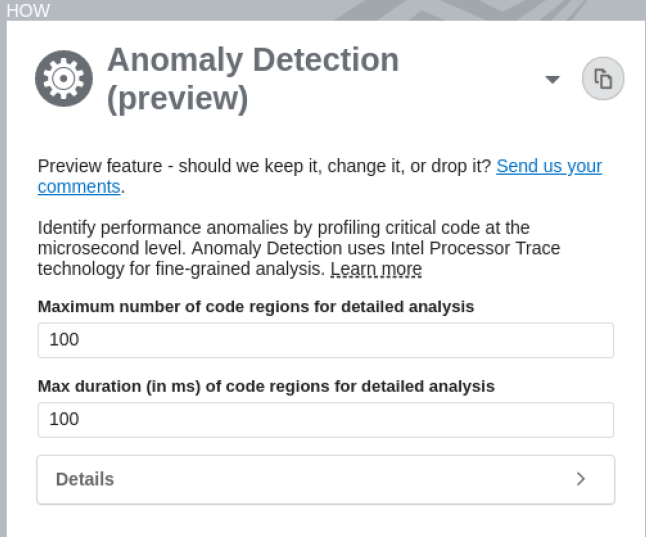
In the HOW pane, specify these parameters to define the volume of data collected for the analysis.
Parameter
Description
Range
Recommended Value
Maximum number of code regions for detailed analysis Specify the maximum number of code region instances for your application that should be loaded with details simultaneously for result analysis.
10-5000
For faster loading of details, pick a value not more than 1000.
Maximum duration of code regions for detailed analysis Specify the maximum duration of analysis time (ms) to be spent on each instance of a code region. Instances that require longer duration are either ignored or not loaded.
0.001-1000
Any value under 1000 ms. You may also want to consider some options to limit data collection as a large volume of data can impact processing efficiency adversely.
Click the Start button to run the analysis.
Identify Anomalies
Once the analysis completes, switch to the Summary window. Take a look at the Code Region of Interest Duration Histogram.
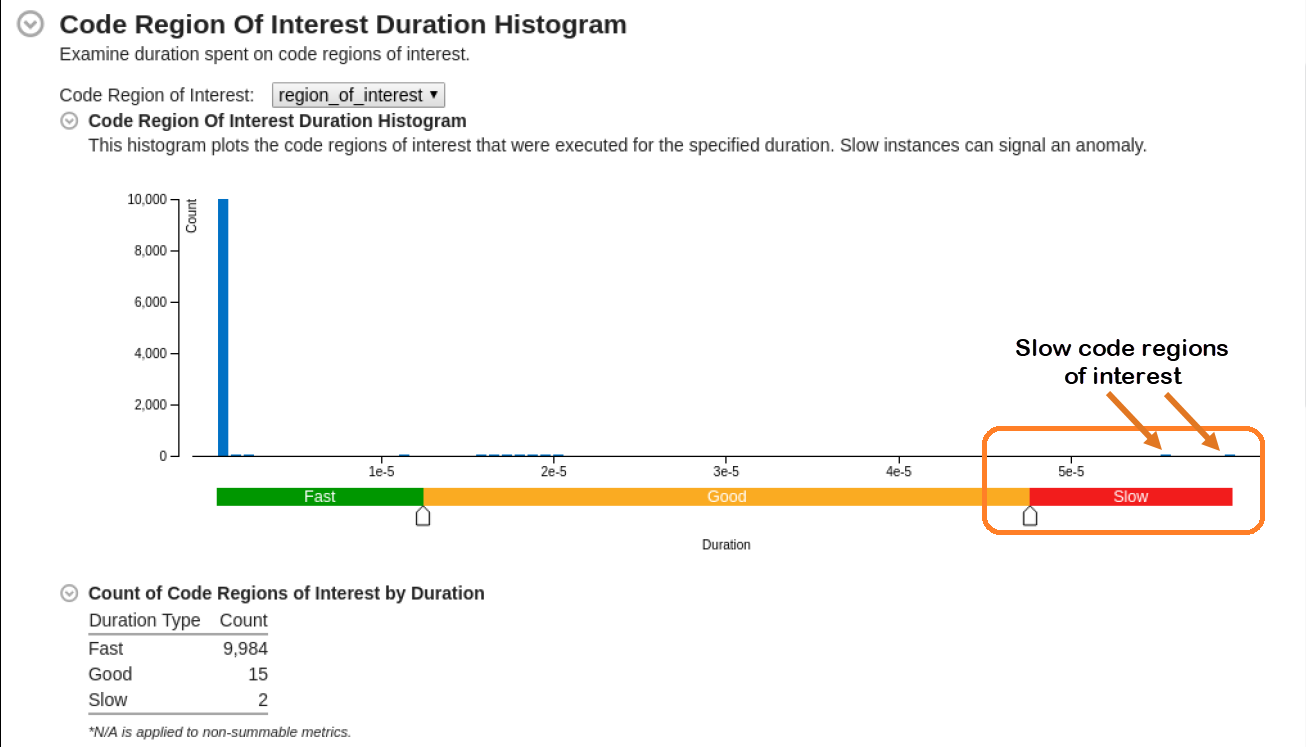
Where performance was slow, move the sliders in the histogram to expose performance outliers.
Switch to the Bottom-up window.
In the Grouping table, load details for slow code regions of interest.
- Expand the view to display Fast and Slow regions.
- Right click on the Slow region in the table.
- In the pop-up menu, select Load Intel Processor Data by Selection.
Select Anomaly for Investigation
Once you load data, switch to the Intel Processor Trace Details view. Examine the information collected for slow code regions.
In this example, the metrics for Inactive and Wait Times were zero, which indicates that there were no context switches.
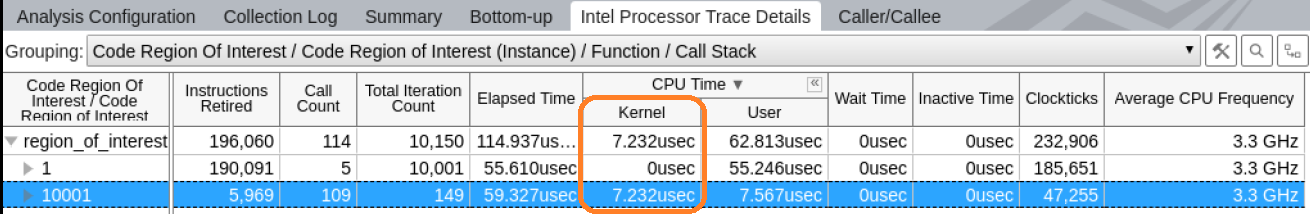
The non-zero kernel time give us a clue about unexpected kernel activity.
From the Code Region of Interest Duration Histogram, we identified two slow code regions of interest. Let us start our investigation with code region instance 10001 which has a significant value for Kernel CPU time.
Investigate Kernel Activity Anomaly
The first anomaly lies in region 10001.
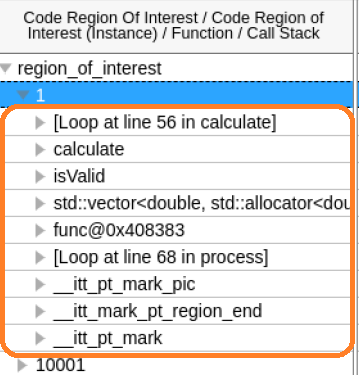
Let us look at the execution details for every code region. In the table, expand the node for a region and check the list of functions that were executed in it.
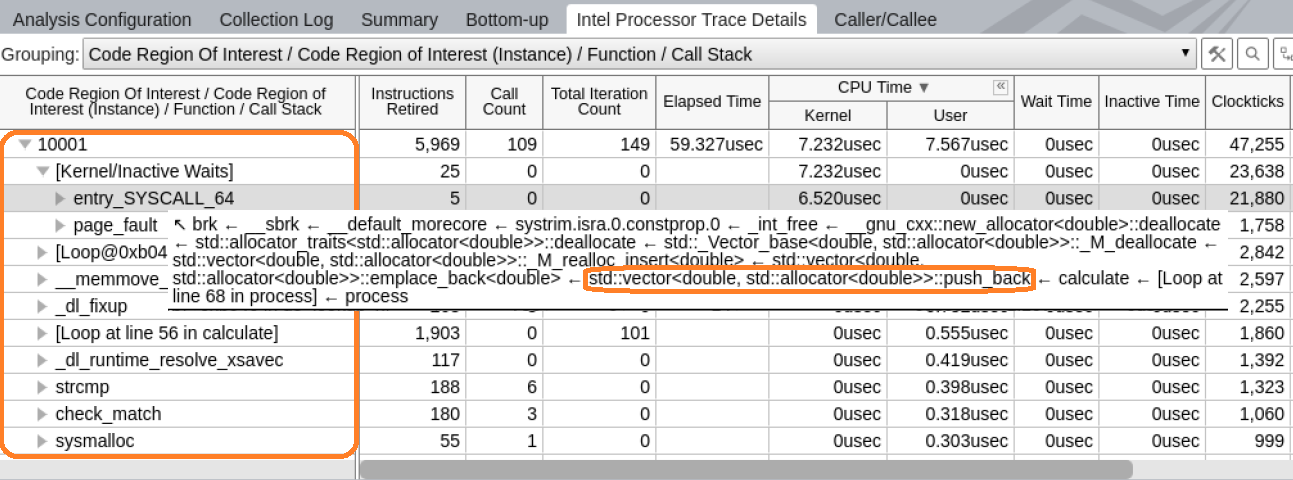
In this example, the Kernel/Inactive Waits element is at the top of the function list. Since the Linux kernel employs dynamic code modification, it is not possible to fully reconstruct the kernel control flow using static analysis of kernel binaries. This node aggregates all performance data for kernel activity that happened while executing this particular code region of interest.
Since kernel binaries are not processed, it is not possible to reconstruct control flow metrics like Call Count, Iteration Count, or Instructions Retired. While Call Count and Iteration Count are zero, Instructions Retired shows the number of entries to the kernel.
The stack for this node contains a full sequence of function calls, including kernel entry points. This explains why the application transfers control to the kernel.
The call stacks for the Kernel/Inactive Waits element grow from the call to the push_back method of std::vector from the calculate method. Open the function in the Source view by double clicking on it.
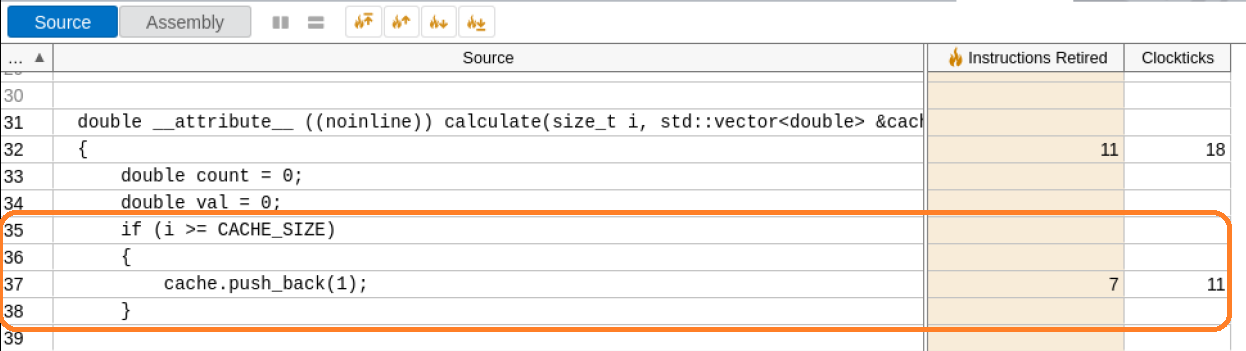
A close examination reveals the cause of the anomaly.
Investigate Control Flow Deviation Anomaly
Next, let us look at a different type of anomaly that we observe in the histogram. In this case, the Instruction Retired metric is unusually high.
This indicates a deviation in control flow during the execution of that code region. When we expand the node in the grid to see the functions executed, upon first glance, nothing looks abnormal.
Let us load the details for fast and slow iterations together so we can compare them.
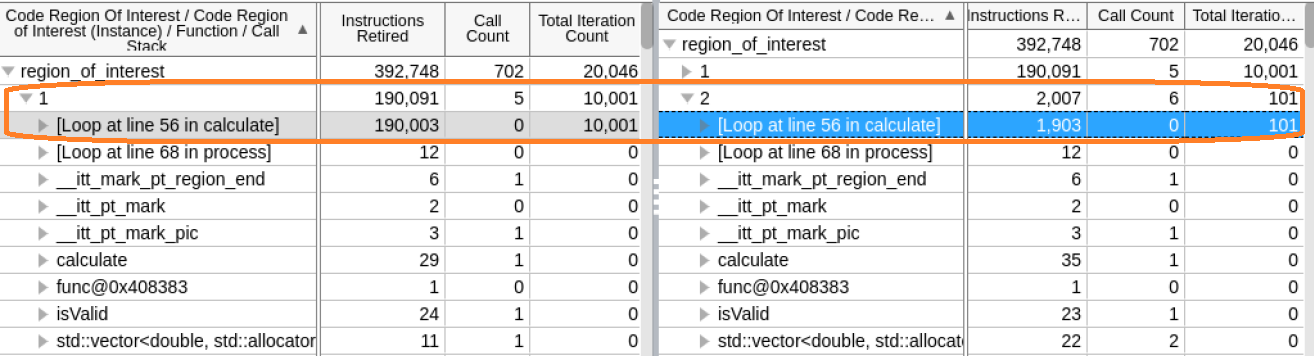
Although the list of executed functions is the same, the anomalous instance ran more loop iterations of the calculate function.
Let us open the calculate function in the Source view for both fast and slow instances .
In the fast instance, the isValid condition is satisfied and a data element is in the cache.
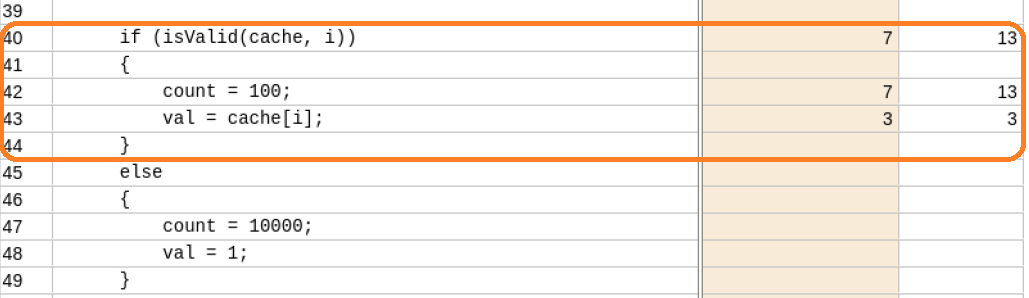
In the slow instance, the isValid condition is not satisfied and it fails to validate a data element in the cache. The else clause goes into effect and this results in additional calculations.

Discuss this recipe in the VTune Profiler developer forum.