A newer version of this document is available. Customers should click here to go to the newest version.
Profiling Windows* Applications for Hybrid CPU Platforms (NEW)
Use this recipe to profile and view hybrid CPU utilization data for Windows-based applications.
A combination of performance cores (P-Cores) and efficient cores (E-Cores) empowers hybrid CPUs to tackle the processing demands of modern workloads, including computer games. Fine tuning your applications enables you to take full advantage of the processing capability of hybrid CPUs, especially if you are using the 12th Generation Intel® Core™ processor.
This recipe describes how you use VTune Profiler to profile and visualize performance data for Windows* applications that run on hybrid CPUs. This recipe highlights two examples with the asteroids_d3d12 executable in the HybridDetect sample. For a description of this sample, see the Game Dev Guide for 12th Gen Intel® Core™ Processor.
Content expert: Jennifer DiMatteo
Ingredients
Application: asteroids_d3d12 executable in the HybridDetect sample
Tools:
- Intel® VTune™ Profiler version 2023 - Hotspots Analysis (using Hardware Event-based Sampling)
- Microsoft* Visual Studio - For versions compatible with Intel® VTune™ Profiler, see Intel® VTune™ Profiler System Requirements.
CPU/GPU: Intel® Core™ i7-12700H
Operating system: Windows* 11 Enterprise
Directions
Build the Sample in Microsoft* Visual Studio
Open the HybridDetect sample in Microsoft* Visual Studio.
Build the sample.
Run Hotspots Analysis
This procedure describes how you run the hotspots analysis in hardware event-based sampling mode using the standalone version of VTune Profiler. If you are using VTune Profiler integrated into Microsoft Visual Studio, in order to run hardware event-based sampling analysis, you must run Visual Studio as an administrator.
Open Intel® VTune™ Profiler and click New Project on the Welcome screen.
Specify a project name and a location for your project.
- Click Create Project.
- In the WHERE pane of the Configure Analysis window, select Local Host.
- In the WHAT pane,
Fill in the Application field with the path to the asteroids_d3d12 executable.
In the Application parameters field, enter -scheduler 0. This parameter ensures that each of the render and update tasks run on individual threads.
- In the Advanced section, select Automatically stop collection after to 30 seconds. Also select Analyze child processes.
In the HOW pane, select the Hotspots analysis type and enable Hardware Event-Based Sampling.
Click Start to run the analysis.
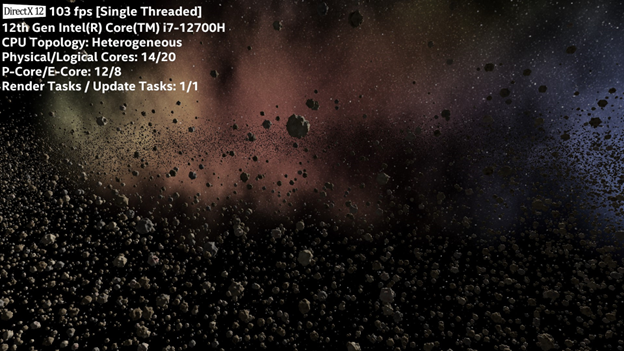
The sample shows that the frame rate is variable at 103 frames per second (fps).
Review Results
After the data collection runs for about 30 seconds, Intel® VTune™ Profiler terminates the application and data collection. Finalizing the results may take a few minutes as Intel® VTune™ Profiler finds and resolves debug symbols.
Once results have been finalized, the Summary tab displays information about:
- Elapsed time
- Top hotspots
- Top tasks
- Additional insights and guidance
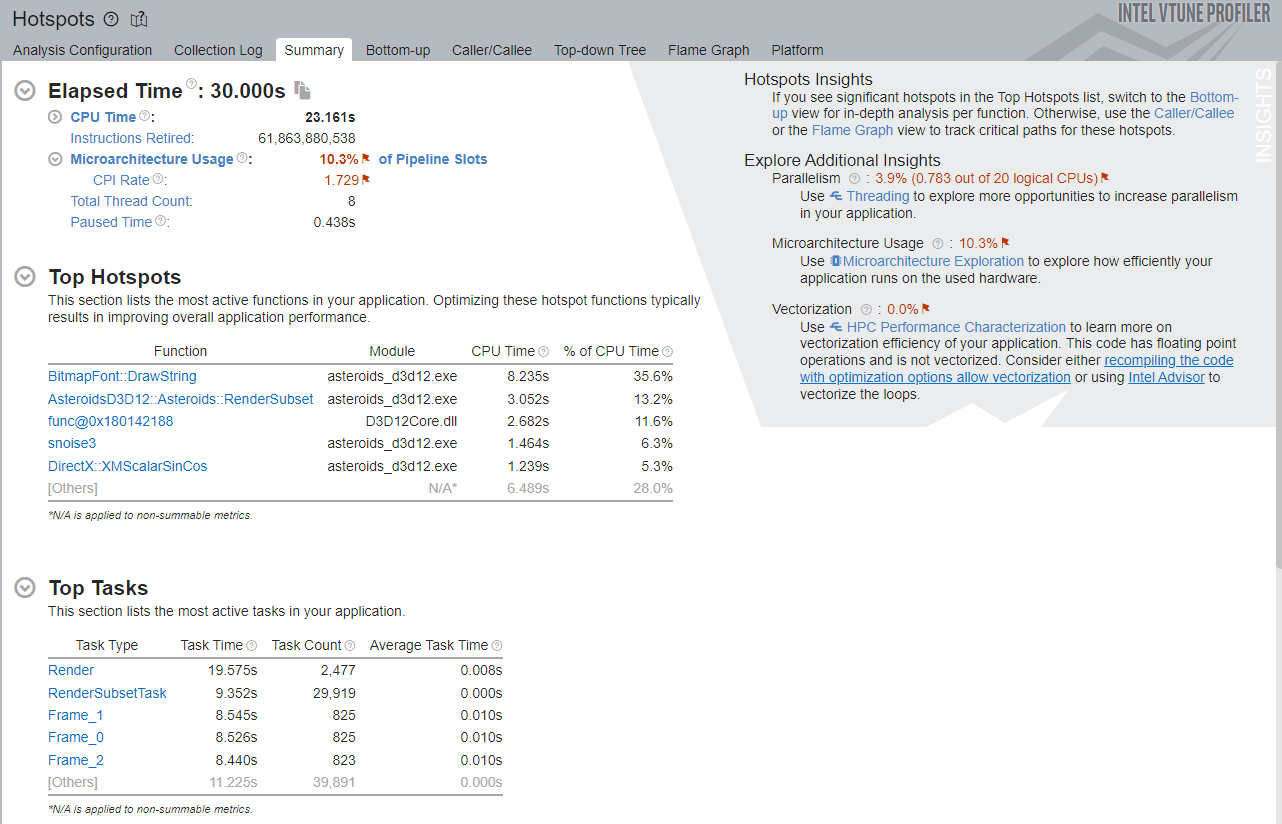
In this example, the top task is DrawString with a high clock cycles per instruction (CPI) rate of 1.729. This means that the execution of instructions is slower than optimal. The thread count is eight, but actual parallelism in the executable is very low. You can infer this detail from the Additional Insights section in the upper right corner. The application is executing instructions very slowly and only on a single CPU.
Next, look at the Bottom-up window.
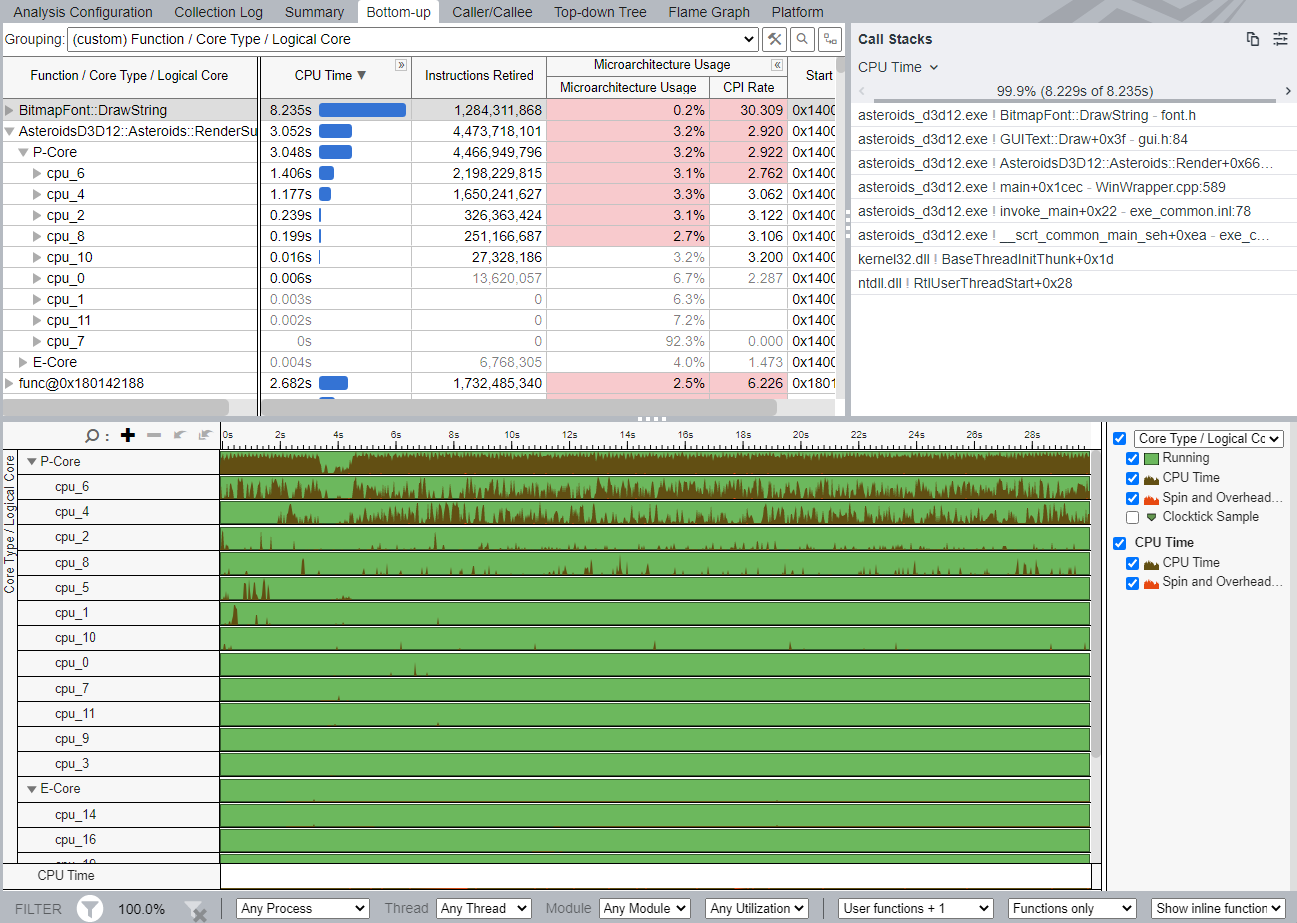
To see how the application uses P-Cores and E-Cores, create a custom grouping. Click the tool icon next to the Grouping pulldown menu and group results by Function/Core Type/Logical Core.
Next, expand the RenderSubset function. You can see that this function ran on two logical P-Cores.
In this manner, you see from the timeline that the entire application used only two P-Cores and hardly any E-Cores. This implies that any execution that happened on E-Cores was too minimal for Intel® VTune™ Profiler to collect and use the data confidently.
Adjust Scheduler Value and Repeat Analysis
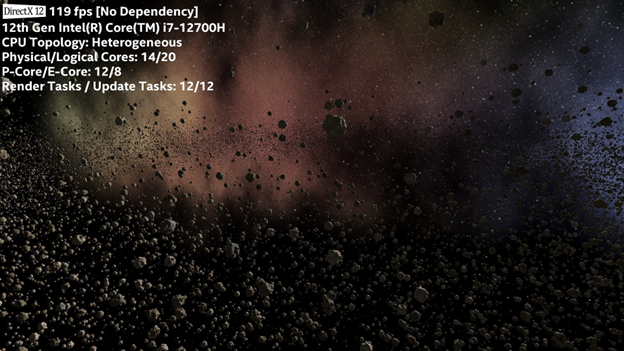
Repeat the hotspots analysis, but this time, set Application parameters to -scheduler 1. This setting ensures that the number of render tasks is equal to the number of P-Cores. Also, there are eight update tasks which now run independent of the render tasks.
Once you repeat the analysis, the application shows that 12 tasks are running. The average frame rate is 119 fps.
When the data collection completes, Intel® VTune™ Profiler finalizes results. The Summary window opens with this information:
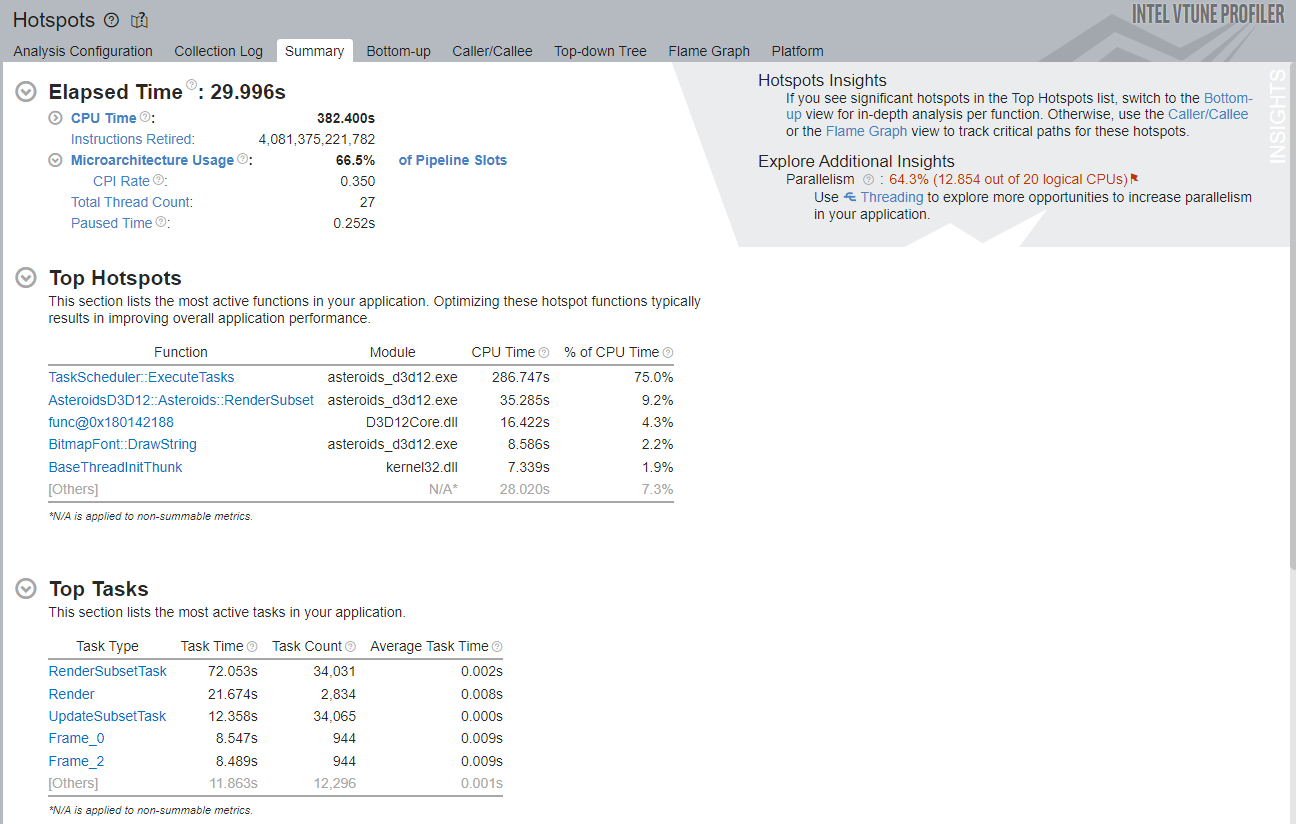
The parallelism is now much higher. Instead of using one logical CPU, the application used over 12 CPUs.
This time, the top function is the TaskScheduler. The total thread count is 27. At 0.35, the CPI rate is much lower now. This may be because the scheduler had a very low CPI rate and accounted for most of the CPU time.
It is important to ensure that the render performance has actually improved, so that the results are not skewed by overhead. The Bottom-up window shows that the CPI rate of the render function improved.
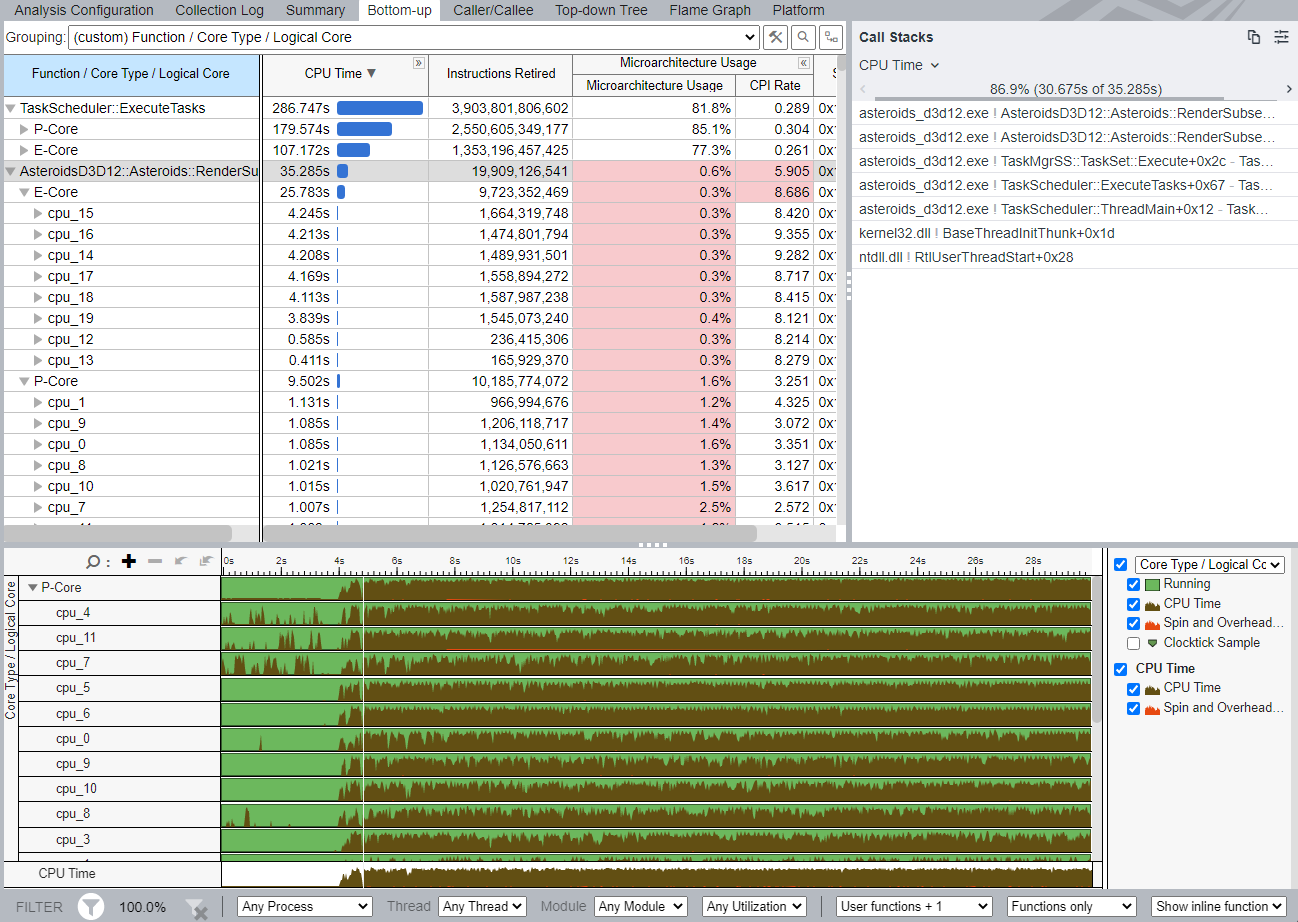
However, the render function ran almost 20 million instructions this time, compared to 4.5 million instructions the previous time. This work was split almost evenly between P-Cores and E-Cores, although P-Cores ran the instructions 2x faster. Again, the timeline shows the overall utilization of cores.
The HybridDetect sample has several configurations which you can use to understand how to control CPU utilization on a hybrid platform. This recipe uses the default pre-compiler macros available in the sample. These macros give you control over the render and update threads, but they let the Intel Thread Detector determine the core type to be used.
As an additional exercise, force the render tasks to run on P-Cores and update tasks to run on E-Cores. To do this, enable the ENABLE_RUNON macro in HybridDetect.h. See how this change affects performance.