Profiling Applications in Amazon Web Services* (AWS) EC2 Instances
This recipe helps you set up a virtual machine (VM) instance in AWS to profile application performance with Intel® VTune™ Profiler.
Content Expert: Jennifer Dimatteo
Ingredients
This section lists the hardware and software tools used for the performance analysis scenario.
Application: Use any application of your choice.
Tools: Intel® VTune™ Profiler version 2023 - Hotspots analysis
NOTE:Starting with the 2020 release, Intel® VTune™ Amplifier has been renamed to Intel® VTune™ Profiler.
Most recipes in the Intel® VTune™ Profiler Performance Analysis Cookbook are flexible. You can apply them to different versions of Intel® VTune™ Profiler. In some cases, minor adjustments may be required.
Get the latest version of Intel® VTune™ Profiler:
From the Intel® VTune™ Profiler product page.
Download the latest standalone package from the Intel® oneAPI standalone components page.
Before You Begin
Understand the system requirements to install VTune Profiler on your machine. Your system must have at least 4 GB of RAM and 10 GB of free disk space.
Review the functionality of VTune Profiler available for different types of AWS instances.
Ensure that the AWS instance can support a connection over SSH (port 22).
The storage size for the root volume should be at least 10 GB for data collection and results.
Create and Configure a Virtual Machine Instance
Set up a virtual machine by following instructions on the AWS site.
Configure the Instance for Profiling
Prepare the target instance for profiling. by setting /proc/sys/kernel/yama/ptrace_scope to 0:
For User-Mode sampling collections, set /proc/sys/kernel/yama/ptrace_scope to 0:
echo 0 | sudo tee /proc/sys/kernel/yama/ptrace_scope
For Hardware Event-Based sampling collections, set /proc/sys/kernel/perf_event_paranoid to 0:
echo 0 | sudo tee /proc/sys/kernel/perf_event_paranoid
For more information on driverless profiling, see Profiling Hardware without Intel Sampling Drivers.
Run Hotspots Analysis
Run a Hotspots analysis using one of these methods:
Use SSH to run a remote collection from VTune Profiler installed locally
Run VTune Profiler directly from the AWS instance
Run VTune Profiler as a web service on the AWS instance
Use SSH to run a remote collection from VTune Profiler installed locally:
(Optional) If you have a .pem key for your AWS instance, complete these steps:
In your user home directory, create or open the config file:
<user home>\.ssh\config
Add these lines to the config file:
Host *.compute.amazonaws.com
User <instance user>
IdentityFile <path-to>\key.pem
If you are using a VPN where a proxy is required, include these lines:
LocalForward 4022 c009:22
ProxyCommand "<net connect utility>" -x proxy-server.com:1080 %h %p
Create a project in Intel® VTune™ Profiler.
In the WHERE pane of the Configure Analysis window, select Remote Linux(SSH).
Locate the public IPv4 DNS address for your instance:
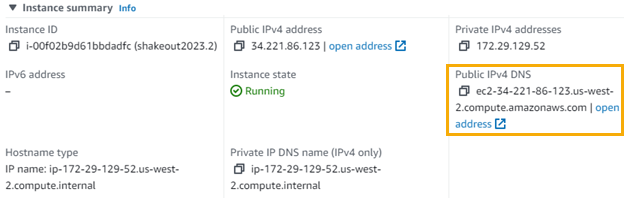
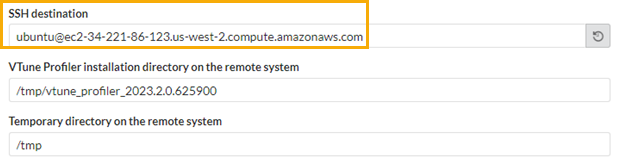
In the SSH destination field, enter <instance user>@<public IPv4 DNS for instance>.
Intel® VTune™ Profiler attempts to connect to the remote system to determine if the binaries necessary for data collection have been installed.
If you updated the config file in step 1, Intel® VTune™ Profiler uses that configuration and key to connect.
Otherwise, you should be prompted to enter a password. Intel® VTune™ Profiler then creates its own SSH key and stores it in <user home>/.ssh. The SSH key is then copied to the authorized_keys file of the instance.
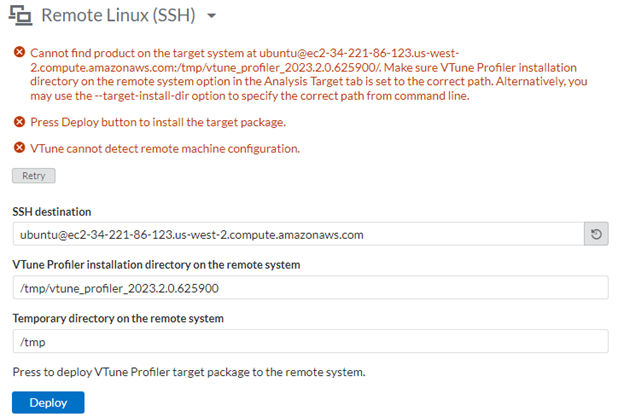
If you see a message that the product cannot be found on the target system, click Deploy to install.
In the WHAT pane, specify the location of your application and its working directory.
In the HOW pane, select Hotspots analysis with User-Mode Sampling collection.
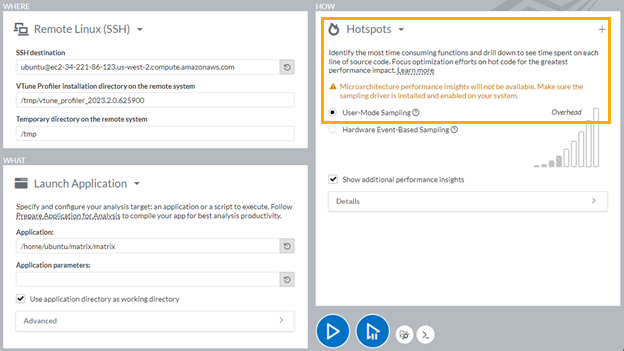
Click
 to start the collection.
Once the analysis completes, Intel® VTune™ Profiler copies the results to your local system for analysis.
Run VTune Profiler directly from the AWS instance:
Install VTune Profiler by following instructions in the Installation Guide.
Run VTune Profiler. For example:
sudo <vtune_install_dir>/vtune_profiler/bin64/vtune-gui
Create a project.
In the Configure Analysis window,
In the WHERE pane, select Local Host.
In the WHAT pane, specify the location of your application and its working directory.
In the HOW pane, select a preferred collection mode for the Hotspots analysis. For example, select Hardware Event-Based Sampling.
Click
to start the collection.
The analysis result opens in the Hotspots by CPU Utilization viewpoint.
Run VTune Profiler as a Web Service on the AWS Instance:
Install VTune Profiler by following instructions in the Installation Guide.
Run the VTune Profiler Web Service:
<vtune_install_dir>/latest/bin64/vtune-backend –-allow-remote-access –-enable-server-profiling –-web-port=8080
The vtune-backend command returns a URL with the private IP for the instance as well as a one-time token.
Replace the private IP with the public IP or DNS for the instance. For example, https://172.29.129.54:8080/?one-time-token=b8cafc89721e781161aba4ddcef5a718 becomes https://18.236.194.236:8080/?one-time-token=b8cafc89721e781161aba4ddcef5a718.
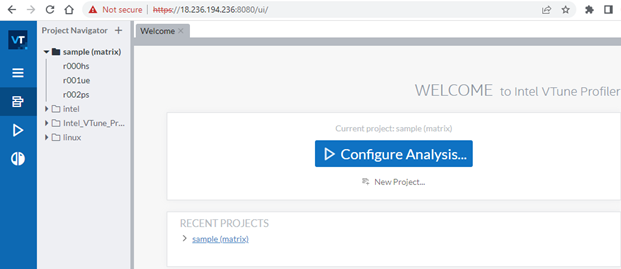
Copy the URL into your browser.
NOTE:The browser may display a warning indicating that the URL might be unsafe. This is because the web service is using a self-signed certificate instead of an officially signed certificate.Create a passphrase at the prompt and proceed to the VTune GUI.
Select Add new remote target.
In the Configure Analysis window,
In the WHERE pane, select Local Host.
In the WHAT pane, specify the location of your application and its working directory.
In the HOW pane, select a preferred collection mode for the Hotspots analysis. For example, select Hardware Event-Based Sampling.
Click
to start the collection.
The analysis result opens in the Hotspots by CPU Utilization viewpoint.