Viewing Analysis Results on a Web Browser (NEW)
Use techniques in this recipe to view analysis results from Intel® VTune™ Profiler in a web browser, particularly on systems where you cannot install VTune Profiler to run the analyses.
Typically, you install VTune Profiler on a host machine and use it to profile an application target on the same machine. Sometimes the host and target operating systems may be different. Depending on the specific operating environment, you may not be able to open the VTune Profiler GUI on the host machine, with access limited to the command line only. If you use a macOS* system, you cannot run VTune Profiler for data collection or viewing, as the platform is not supported. When you are unable to use the VTune Profiler user interface, you can open analysis results in a web browser instead.
Use a web browser to view analysis results when:
- You need easy access. Multiple users across multiple systems can access the results.
- You need to manage a single repository. When you have a large volume of results, save them on a system with sufficient storage without having to copy the results to local systems.
- You want to manage fewer versions of VTune Profiler. You use a single viewer and avoid mismatches between the versions of VTune Profiler used for data collection and viewing.
- You want to improve the finalization of results. For better resolution of symbols, store the debug versions of binaries and sources in a single location.
- You want to view results without relying on the VTune Profiler UI. See analysis results on a Linux server without having to install VTune Profiler.
Content expert: Jennifer DiMatteo
Ingredients
Application: matrix sample available with the installation of VTune Profiler
Tools: Intel® VTune™ Profiler version 2023 or newer
Browser: Google Chrome*
Operating system: Windows* 11 Enterprise, Ubuntu 22.04
Directions
Configure Your System for Intel® VTune™ Profiler Web Server
To use Intel® VTune™ Profiler web server, choose a system that has:
- Plenty of storage. A single Intel® VTune™ Profiler result can be over 1 GB in size.
- An open web port for user access. You specify this port for use when you run Intel® VTune™ Profiler from the command line.
Additionally, when you profile remote systems, ensure these details:
- Ensure that the system you use to run the web server has the same operating system as the target system(s) used for data collection. These should be Linux or Windows machines. This is necessary for proper SSH communication between the server and the target. If you copy results manually into the server result directory, you can use results from any OS.
- Enable SSH communication between the web server and the target(s).
Start Intel® VTune™ Profiler Web Server
This example uses an installation of Intel® VTune™ Profiler on a Linux system.
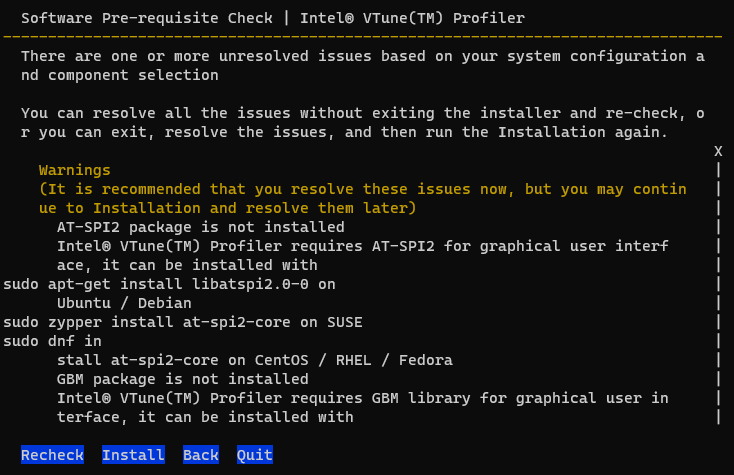
- Install Intel® VTune™ Profiler as root or administrator with default configurations. If you install on a Linux OS, you may encounter warnings about missing GUI libraries. You can ignore these warnings as the libraries are not required to run the web server.
- Select a user who can run the web server. The credentials of this user are used to run the data collection, including the availability of hardware profiling and access to the target process. For example, to use the hardware driver of Intel® VTune™ Profiler, the user must have group access. The default group is vtune. For more information about using the hardware driver, see Sampling Drivers.
- Start the Intel® VTune™ Profiler web server. Use the vtune-backend command. Configure these options:
Use these commands:
Option Purpose web-port This port must be accessible by remote connections. If this port is not specified, Intel® VTune™ Profiler chooses a random port that is available. data-directory Intel® VTune™ Profiler searches for results in this directory. By default, this is in the home directory of the user who started the web service. If you provide a custom directory, ensure that the user starting the web service has access to the custom directory. enable-server-profiling This option enables the web service to profile the server on which it runs. allow-remote-access Use this option to enable browser access from systems other than localhost. - Linux OS:
$ vtune-backend –web-port=8080 –data-directory=/mnt/vtune-results/ --enable-server-profiling –allow-remote-access &
- Windows OS:
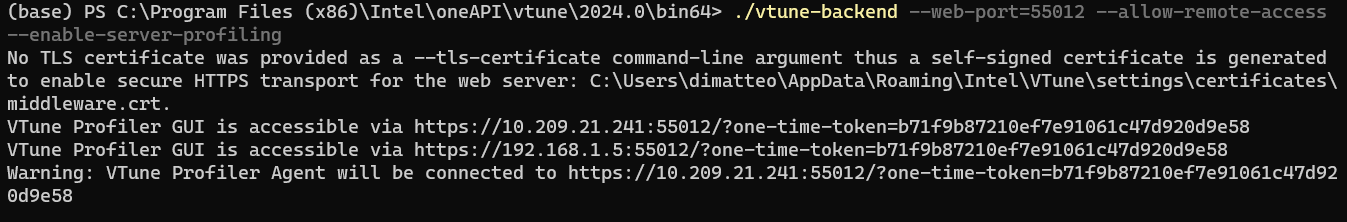
C:\Program Files (x86)\Intel\oneAPI\vtune\latest\bin64\vtune-backend --web-port=55012 --allow-remote-access --enable-server-profiling
- Linux OS:
When the web service begins, a URL displays which you can paste into your local browser. If this is the first time you are starting web service on the system, the URL contains a one-time token you use to set a security passphrase.
Run a Collection
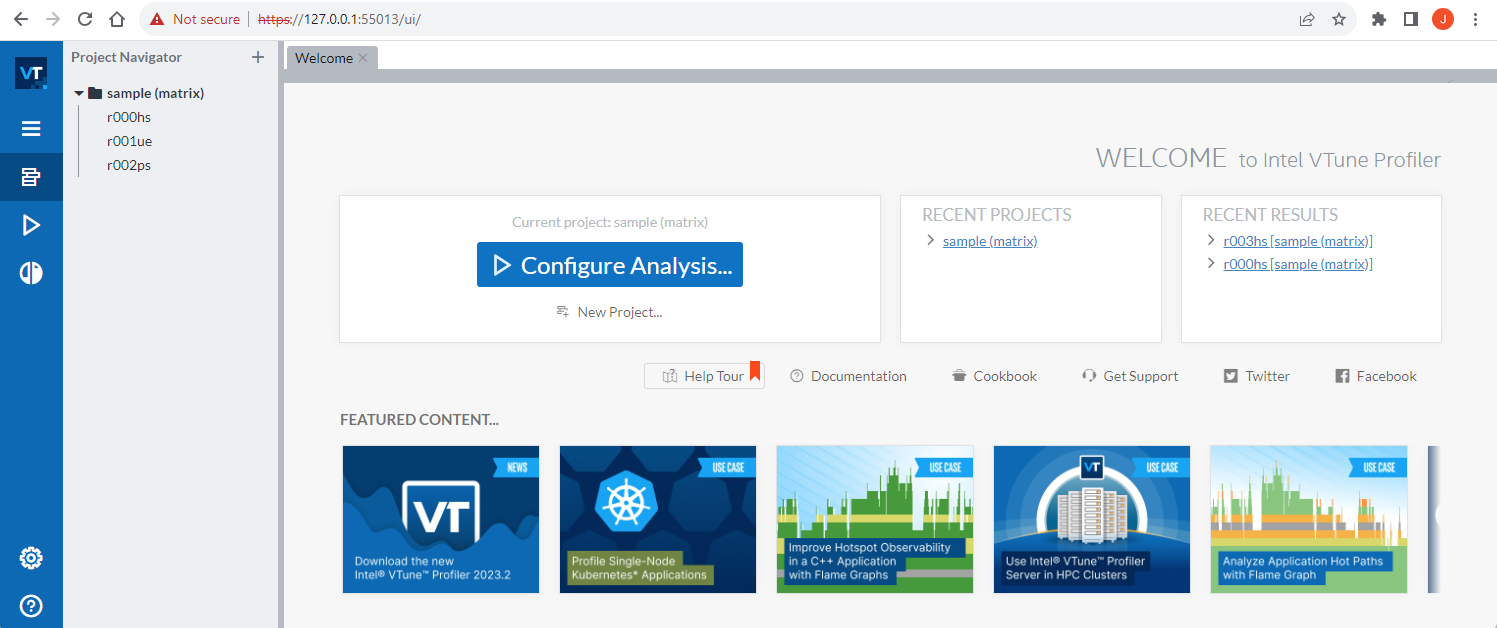
The installation package of Intel® VTune™ Profiler includes a matrix multiply sample with results. If you use the default data directory, these results display in the user interface on the browser.
You can run a data collection in these ways:
| Method | Notes |
|---|---|
| Run a collection on the web server. | Use the default settings in the WHERE pane. |
| Configure a remote system. | You must install the collection agent on the target. You can do this manually or automatically. For more information, see Deploy the Intel® VTune™ Profiler Agent . |
| Run a collection on the target and copy results over. | Install Intel® VTune™ Profiler manually on the target OS. Run a data collection and then copy the results into the data directory of the server. This method is useful if remote collection is not possible due to SSH or permission issues. You can also use this method to view results without needing to run a new data collection. |
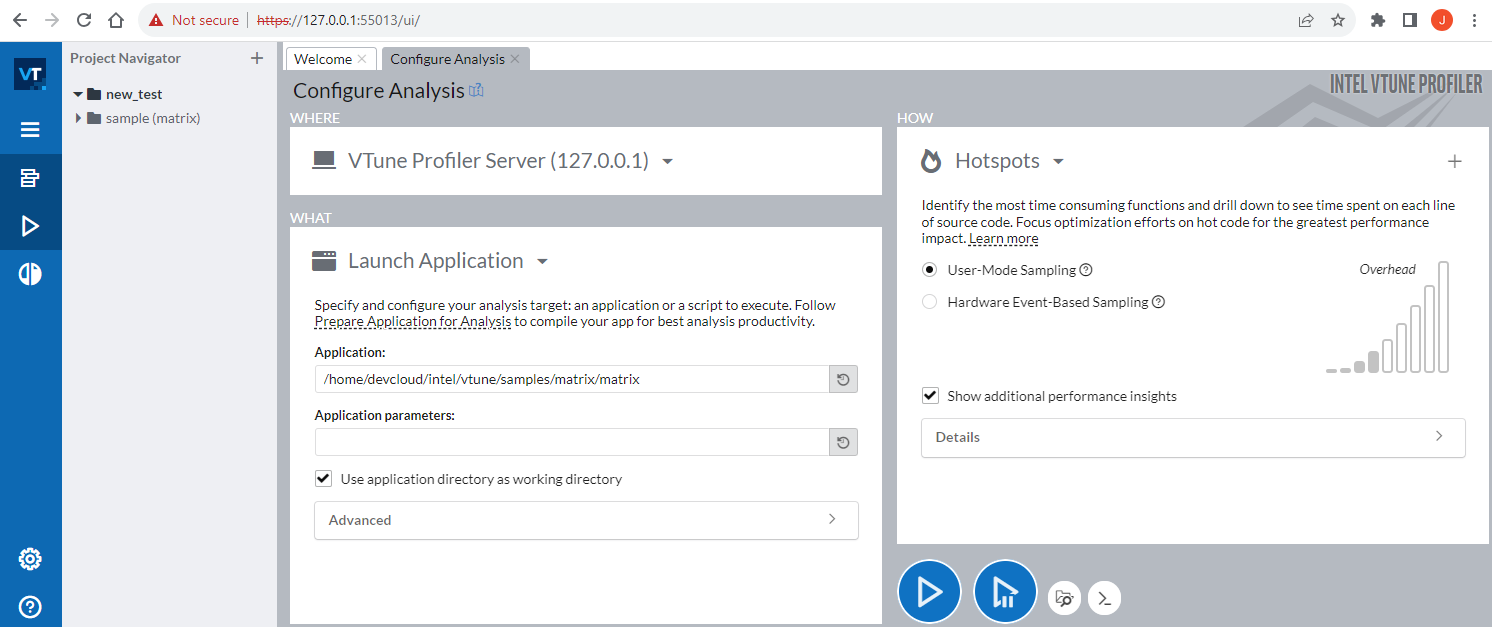
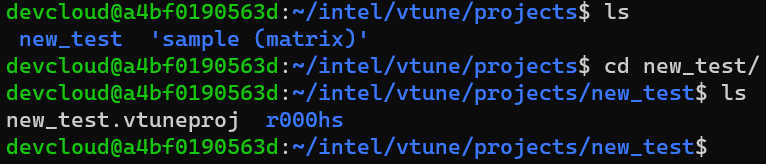
This example demonstrates the first method to run a Hotspots analysis on the matrix sample on the web server. For this purpose, create a new project (called new_test) so you can see how results are structured on the server:
Once results have been collected, they are available in the new_test data directory:
When you collect or open Intel® VTune™ Profiler results this way, you do not install or copy anything onto your local system. Intel® VTune™ Profiler and the collected results exist only on the remote devcloud system.