Profiling Docker* Containers
Intel® VTune™ Profiler allows you to profile applications running in Docker* containers, including profiling multiple containers simultaneously. This recipe guides you through the configuration of a Docker container and describes ways to use VTune Profiler to analyze one or multiple concurrently running containers. This recipe also utilizes the Java* Code Analysis capabilities of VTune Profiler.
Ingredients
This section lists the hardware and software tools used for the performance analysis scenario.
Application: MatrixMultiplication. This Java application is used as a demo and is not available for download.
Tools: Intel VTune Profiler 2021.2.0 - Hotspots analysis with Hardware Event-Based Sampling.
NOTE:Starting with the 2020 release, Intel® VTune™ Amplifier has been renamed to Intel® VTune™ Profiler.
Most recipes in the Intel® VTune™ Profiler Performance Analysis Cookbook are flexible. You can apply them to different versions of Intel® VTune™ Profiler. In some cases, minor adjustments may be required.
Get the latest version of Intel® VTune™ Profiler:
From the Intel® VTune™ Profiler product page.
Download the latest standalone package from the Intel® oneAPI standalone components page.
Linux container runtime: docker.io.
Operating system: Ubuntu* 20.04 based on Linux* kernel version 5.4 or newer.
CPU: Intel® microarchitecture code named Skylake or newer
Install and Configure a Docker* Container
Prerequisites:
- Install a Docker container. See official Docker documentation available at https://docs.docker.com/install/linux/docker-ce/ubuntu/.
- Check if your user is in the docker group. Otherwise, use sudo for the docker.
- Pull a docker image that you want to use.
host> docker pull ubuntu:latest
- Run the container. Keep it running using the -t and -d options.
host> docker run -td ubuntu:latest
- To analyze Docker containers with VTune Profiler using User-Mode Sampling or Memory Consumption analyses, make sure to enable ptrace support.
host> docker run --cap-add CAP_SYS_PTRACE --name=test_container -td ubuntu:latest
- If you want to analyze Docker containers with VTune Profiler using Hardware Event-Based Sampling analysis, enable the CAP_SYS_ADMIN capability.
host> docker run --cap-add CAP_SYS_ADMIN --name=test_container_0 -td ubuntu:latest
You can also launch the container in the privileged mode.host> docker run –-privileged --name=test_container_0 -td ubuntu:latest
- Copy your Java application with the Java Virtual Machine (JVM) to the docker instance that is running.
host> docker cp openjdk-16_linux-x64_bin.tar.gz test_container_0:/var/local
host> docker cp MatrixMultiplication.java test_container_0:/var/local
- Use the container name to get bash into this container in the background mode.
host> docker exec -it test_container_0 /bin/bash
- Extract the jdk archive.
Run Hotspots Analysis with Hardware Event-Based Sampling for Target in Container
In this procedure, we run VTune Profiler on the host machine to profile a target in a docker container.
Run the Java application in the container.
container> cd /var/local container> /var/local/jdk-16/bin/java -cp . MatrixMultiplication 2000 2000 2000 2000- On the host, run a system-wide analysis by starting the Profile System analysis:
host> cd /home/user/intel/oneapi/vtune/latest
host> source vtune-vars.sh
host> vtune -collect hotspots -knob sampling-mode=hw -knob enable-stack-collection=true -knob stack-size=4096 --duration 60
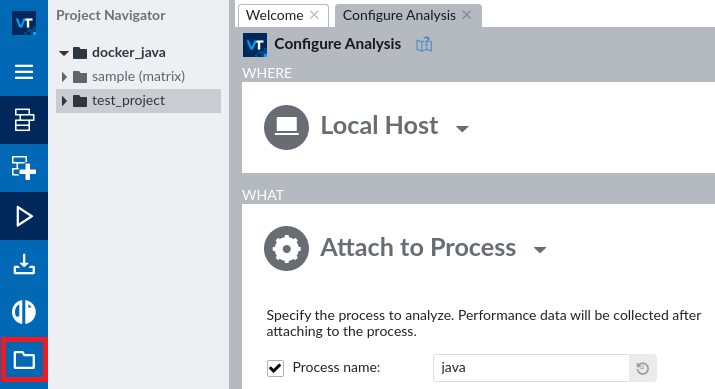
NOTE:You can also profile your application when it is running in a Docker container, using the Attach to Process target type.host> vtune -collect hotspots -knob sampling-mode=hw -knob enable-stack-collection=true -knob stack-size=4096 –target-process java
However, you cannot profile applications running in the container that are instrumented with ITT/JIT API.
Analyze Data Collected for Target in Container
- When the data collection is complete, start the VTune Profiler GUI.
host> vtune-gui
- Create a project for the collected results, say docker_java.
- Open the collected results.
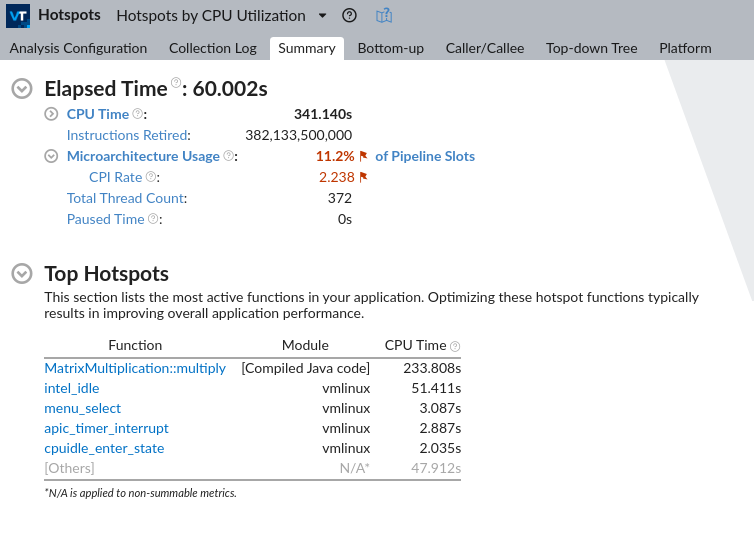
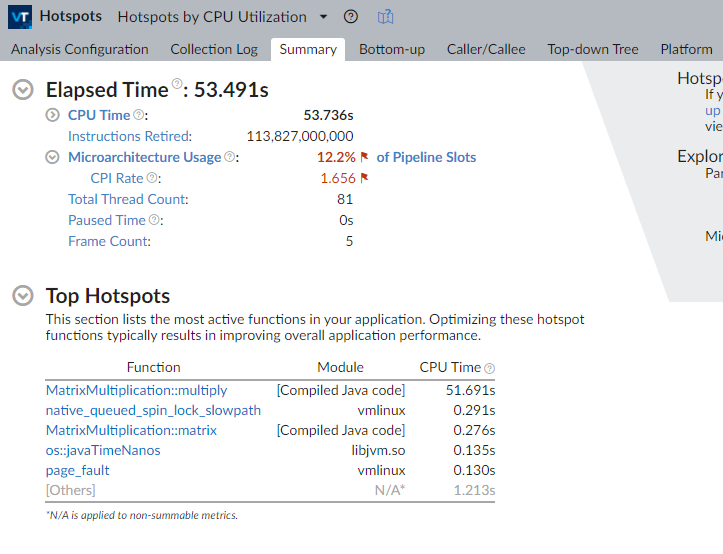
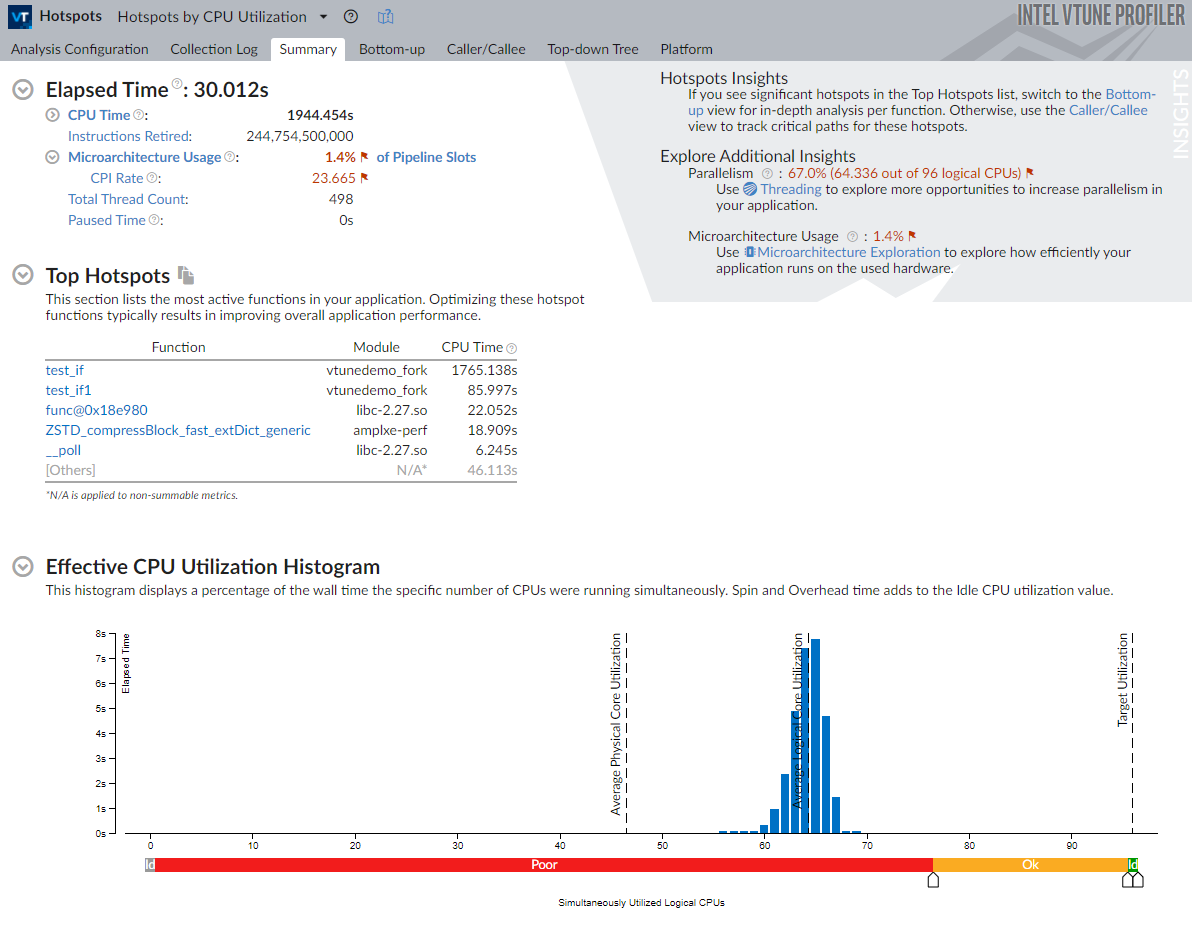
- Review the results in the Summary tab of the Hotspots analysis.
We infer from the Top Hotspots section that the multiply function of the target application consumed the most CPU time.
- Click on the multiply function in the list to switch to the Bottom-up tab. View the stack flow for this hotspot function.
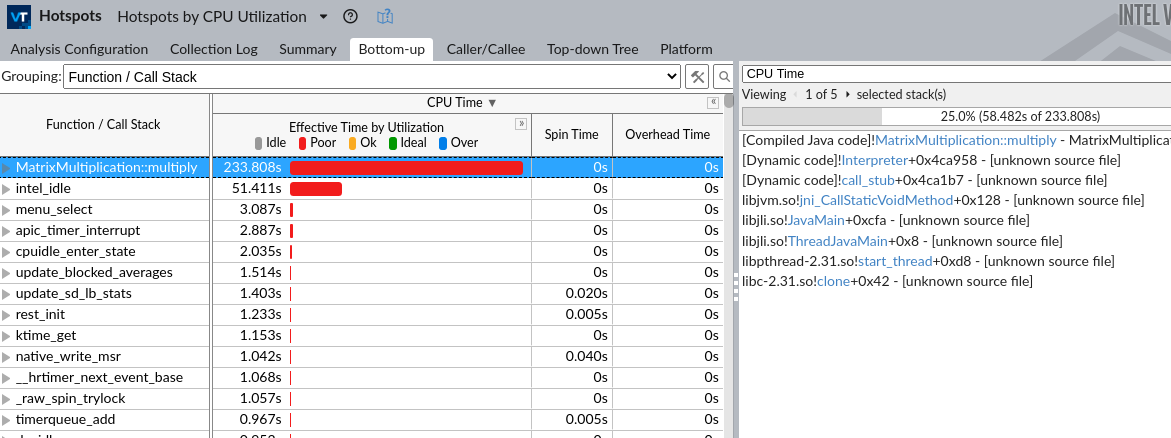
- Double click on the hottest function in the table to identify the hotspot source code line for that function. You can then analyze the metric data collected for this line.
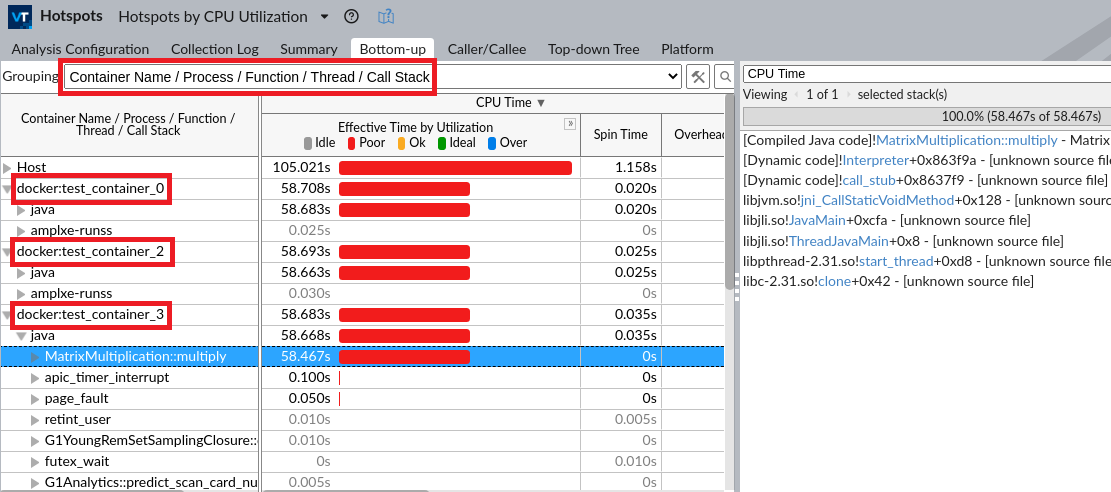
- To view performance data for individual docker containers, select the Container Name/Process/Function/Thread/Call Stack grouping from the pull down menu. Identify containers by the docker prefix.
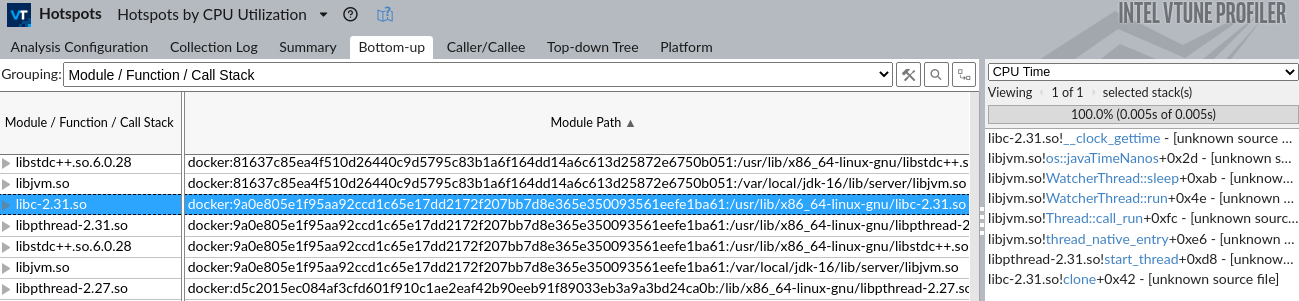
- To view the performance data for system binaries that are running inside a container, select the Module/Function/Call Stack grouping. Locate the entries with the docker prefix in the Module Path column.
In this grouping mode, you can also view performance data for host system binaries and containerized system binaries simultaneously.
Run Hardware Event-Based Hotspots Analysis With VTune Profiler and Target Running in Same Container
- Pull the docker image of oneapi-basekit.
host> docker pull intel/oneapi-basekit
- Run the docker container with CAP_SYS_ADMIN capability to enable profiling from the container.
host> docker run -dt --name=my_oneapi_container --cap-add CAP_SYS_ADMIN intel/oneapi-basekit
- Once the collection is complete, do one of the following: you can either or .
- Copy and view the collected data outside the container. Exit this procedure.
- Use VTune Profiler Server opened in the same container. Go to step 4.
- Use VTune Profiler Server to view collected data.
- Publish a port outside the container by using --publish.
host> docker run -dt --name=my_oneapi_container --cap-add CAP_SYS_ADMIN --publish 7788:7788 intel/oneapi-basekit
where--publish 7788:7788 maps TCP port 7788 in the container to port 7788 on the host.
- Start VTune Profiler Server inside the container.
my_oneapi_container> vtune-backend --allow-remote-ui --web-port=7788 --enable- server-profiling &
where--allow-remote-ui allows remote UI clients.
--web-port=7788 is the HTTP/HTTPS port for web UI and data APIs.
--enable-server-profiling allows users to select the hosting server as the profiling target.
& runs the command in the background.
The vtune-backend command returns a URL that you can open outside the container. For example,
Serving GUI at https://b06036cef42c:7788?one-time-token=4db58f1ad7225e4dccca60573e4c1fd2
Serving GUI at https://172.17.0.8:7788?one-time-token=4db58f1ad7225e4dccca60573e4c1fd2
- On the host machine, open the URL reported by vtune-backend in a browser.
- Change the port on the container (used by vtune-backend) to the port you specified when creating the container.
NOTE:The IP address in this output is the IP address of the container. You can access this address only from the host where the container is running. To access VTune Profiler Server from outside the host, use the IP address or hostname of the external host.
- Create a project, say vtune_in_docker.
- Copy your Java application to the host folder in the container or mount application.
host> docker cp openjdk-16_linux-x64_bin.tar.gz my_oneapi_container:/var/local/
host> docker cp MatrixMultiplication.java my_oneapi_container:/var/local/
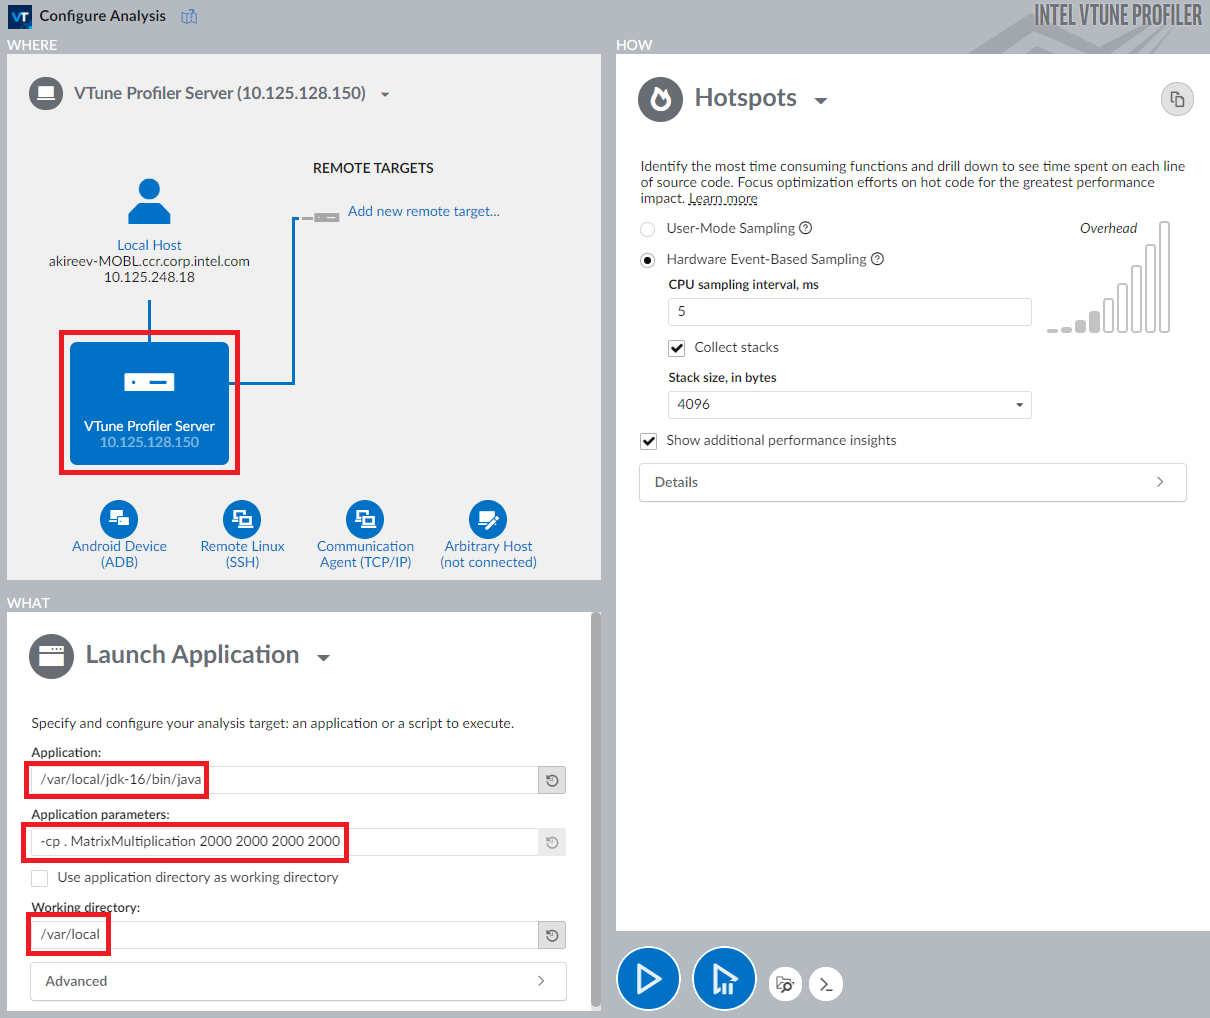
- You can run User-mode and Hardware Event-based Hotspots analysis in both Launch and Attach to Process modes within the container. For example, start the Hardware Event-based Hotspots analysis in Launch mode.
- Once the analysis finishes, view results in the Summary tab.
- Publish a port outside the container by using --publish.
Run Profile System Analysis for Host Target From Container
- Start a docker container with --pid=host and --cap-add CAP_SYS_ADMIN options to collect data and with mounted host folders. Specify the binaries and symbols of the application for Function and Source level analysis of collected data.
host> docker run -dt --name=my_oneapi_container -v /host_path:/container_path --pid=host --cap-add CAP_SYS_ADMIN --publish 7788:7788 intel/oneapi-basekit
where:-v /host_path:/container_path mounts the host path "/host_path" inside the container path "/container_path".
--pid=host sets the PID namespace of the host inside the container.
--publish 7788:7788 maps the TCP port 7788 in the container to port 7788 on the host.
- To analyze the collected data, do one of the following:
- Copy and view the collected data outside the container and on a different system. Exit this procedure.
- Use VTune Profiler Server opened in the same container. Go to step 3.
- To view results in VTune Profiler Server, start the server inside the container.
my_oneapi_container> vtune-backend --allow-remote-ui --web-port=7788 --enable-server-profiling &
where--allow-remote-ui allows remote UI clients
--web-port=7788 sets the HTTP/HTTPS port for web UI and data APIs
--enable-server-profiling allows users to select the hosting server as the profiling target
& runs the command in the background
The vtune-backend command returns a URL that you can open outside the container. For example,Serving GUI at https://b06036cef42c:7788?one-time-token=4db58f1ad7225e4dccca60573e4c1fd2 Serving GUI at https://172.17.0.8:7788?one-time-token=4db58f1ad7225e4dccca60573e4c1fd2
- On the host machine, use a browser to open the URL reported by vtune-backend. Change the port of the container used by vtune-backend to the port you specified when creating the container.
NOTE:The IP address in this output is the IP address of the container. You can access it only from the host where the container is running. To access vtune-server from outside of the host, use IP address or hostname of the external host.
- Create a project, say vtune_in_docker.
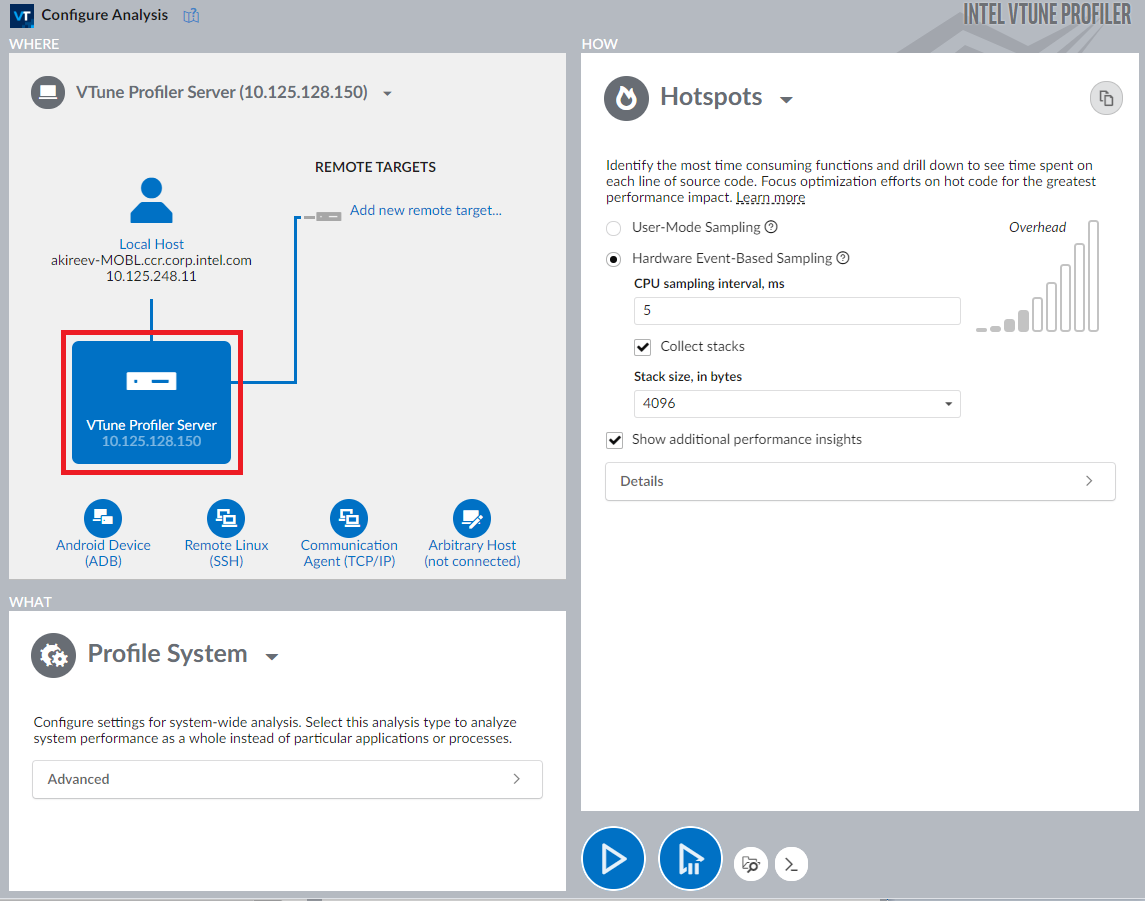
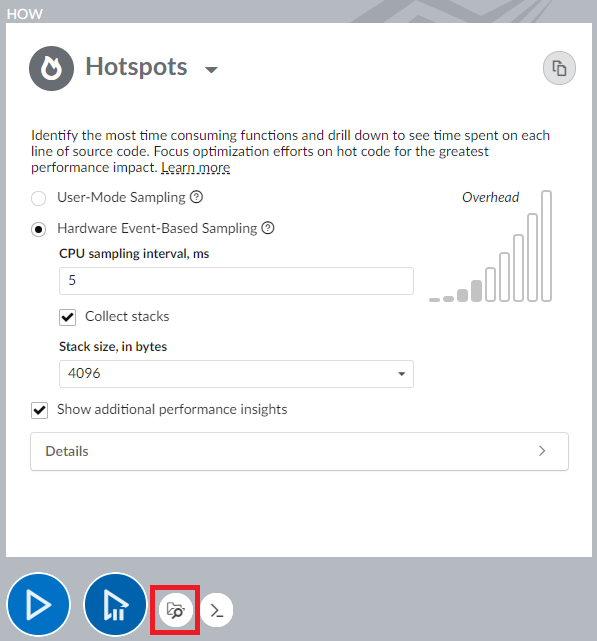
- In the container, run Hardware Event-based Hotspots in the Profile System mode.
- Specify the locations of source and binaries to enable source-level and function-level analysis.
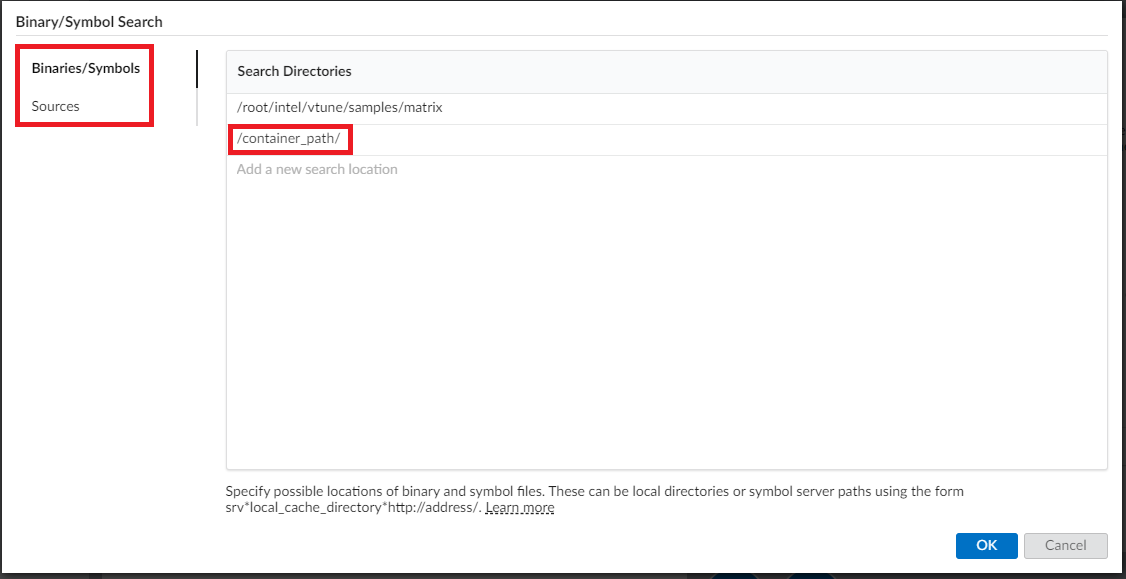
- Start a command line collection from the container by specifying binary and search directories with the -search-dir and -source-search-dir options . To access the results from the GUI, point -result-dir to the current location of the VTune project.
my_oneapi_container> vtune -collect hotspots -knob sampling-mode=hw -knob stack-size=4096 --duration 30 -result-dir=/root/intel/vtune/projects/vtune_in_docker/r@@@{at} -search-dir /container_path -source-search-dir /container_pathNOTE:Use the Attach to Process mode to profile your application running in a docker container.my_oneapi_container> docker exec my_oneapi_container vtune -collect hotspots -knob sampling-mode=hw -result-dir=/root/intel/vtune/projects/vtune_in_docker/r@@@{at} -search-dir /container_path -source-search-dir /container_path -target-process matrix - Once the analysis completes, see results in the Summary tab.
The Top Hotspots section of the Summary view shows that the multiply function of the target application consumed the most CPU time.
- Click the multiply function in the list and switch to the Bottom-up tab.
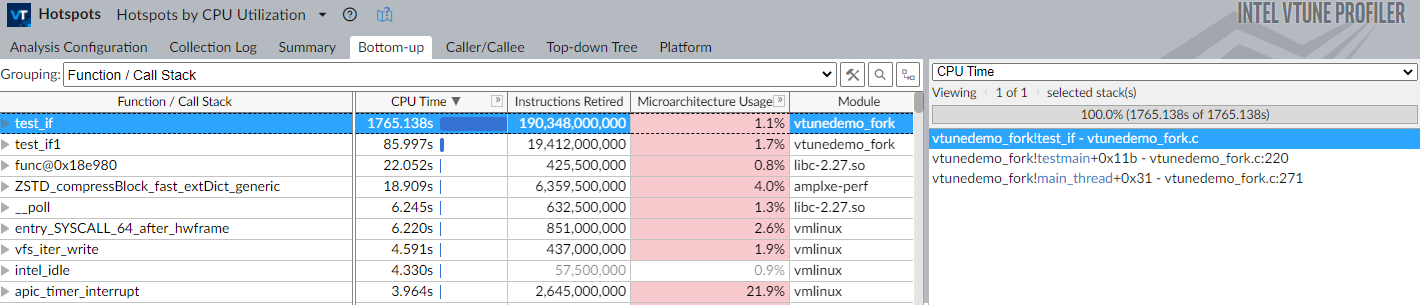
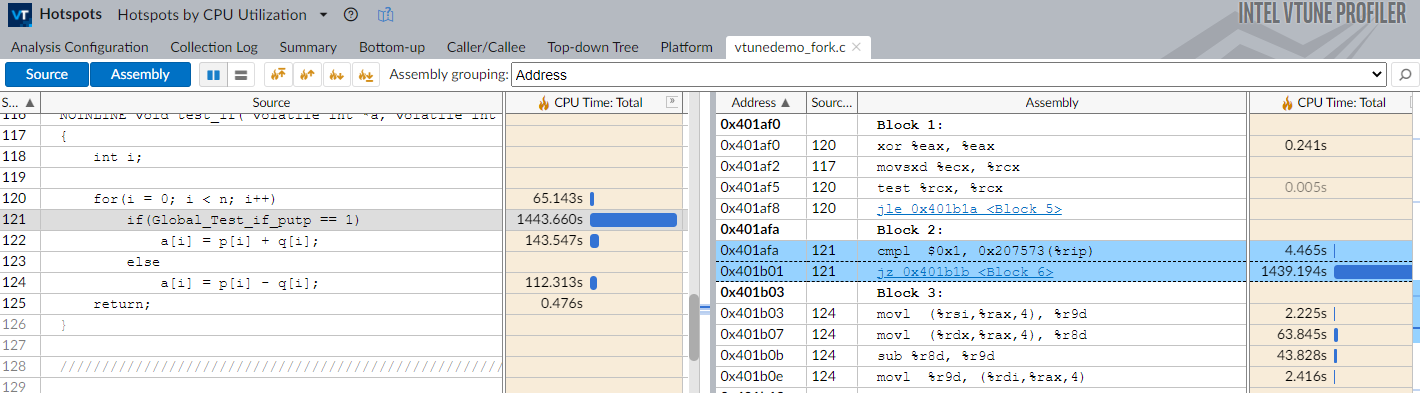
- Double click on the test_if function to examine the source level analysis for this function.
- You can only profile C/C++ applications.
- You cannot profile applications instrumented with ITT/JIT API.
Discuss this recipe in the Analyzers developer forum.