Introduction
This article provides information on the Intel® Xeon® processor Scalable family IIO PerfMon events that count data bandwidth, explains how to run Intel® VTune™ Amplifier performance analysis on these platforms and interpret results …
Intel Xeon processor Scalable family architecture adds new capabilities for IO performance monitoring (PerfMon) that enable counting the data bandwidth per Integrated Input/Output controller (IIO). This is an improvement over previous generations that provided bandwidth counting for aggregate IO with no breakdown of bandwidth per PCI Express* port. With the capability to monitor IO bandwidth for each IIO, you can measure IO traffic to determine bottlenecks, bandwidth limits, balance IO traffic, and application utilization of IO devices.
For programming information, register details, full event lists and additional information on Intel Xeon processor Scalable family performance monitoring, please refer to Intel® Xeon® processor Scalable family Uncore PerfMon Reference Manual.
Intel® Xeon® Processor Scalable Family Uncore
Before you start, it is recommended to review the Intel® Xeon® processor Scalable family Technical Overview for basic understanding of the uncore units and the mesh.
IIO Overview
The purpose of the Integrated Input/Output controller (IIO) is to manage all the traffic between the PCI Express domain and the mesh domain. An “IIO stack” is a collection of components that together connect a PCI Express bus to the mesh. Intel Xeon processor Scalable family contains up to 5 of these IIO stacks per socket:
- IIO0 is the Cstack and connects a x4 DMI (or x4 PCIe*) lane to the mesh and may also contain the Crystal Beach DMA (CBDMA) engine.
- DMI connects to the off package peripheral controller hub (PCH).
- IIO1-3 are the Pstacks and a bridge between x16 PCIe lane and the mesh. Lanes may be bifurcated to 1x16, 2x8, 4x4 and 1x8, 2x4.
- IIO4 is MCPstack that connects a multichip package (such as Cornelis Networks) to the mesh via 2x8 lanes.
The figure below illustrates an example of the five IIO stacks with each Pstack configured as 1x16 PCIe.
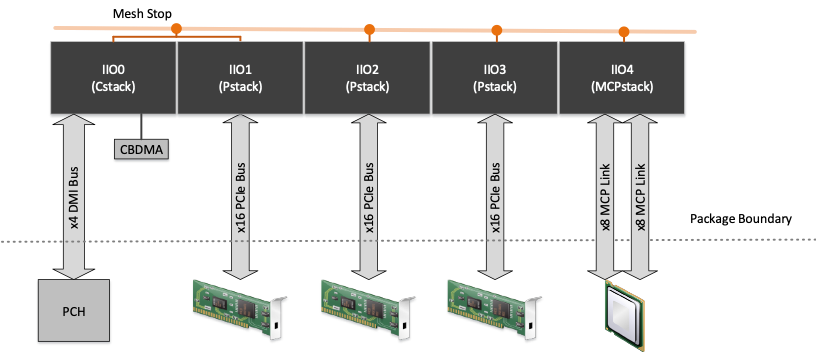
Each IIO stack is connects to a mesh stop that interfaces with the rest of the uncore as shown below.
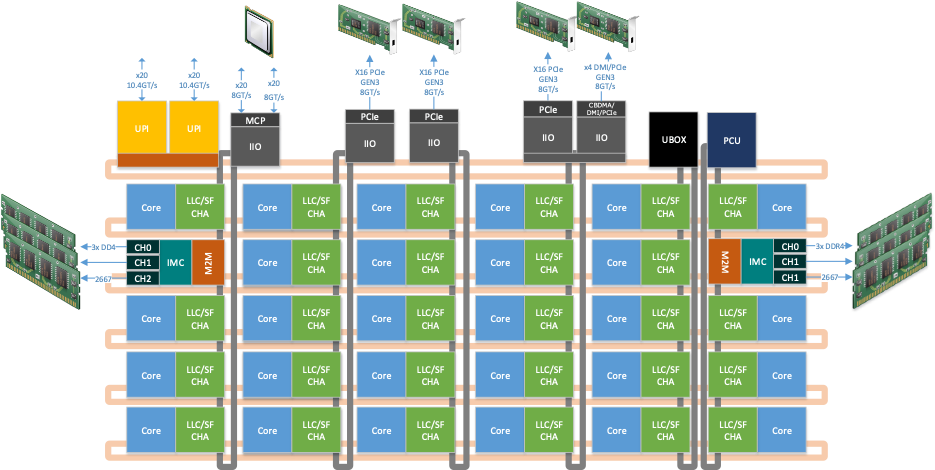
This figure represents a possible uncore configuration. Core, uncore unit counts and configuration are SKU specific.
IIO Traffic Flow
To make use of the IIO PerfMon events, it is important to understand a typical flow of data through an IIO stack for operations such as storing and loading data from the end device. It may seem counter intuitive but when “writing to IO” (such as storing to disk or transmitting network data), the data is pulled from memory via reads issued by the end device. Therefore, the IIO PerfMon events would report read bandwidth. Likewise, when data is “read from IO” to memory (such as reading a disk file or receiving network data), the data is moved to memory via writes issued by the end device.
The following examples show a simplified flow of reading and writing from disk. A similar flow occurs for other PCIe devices such as network controllers.
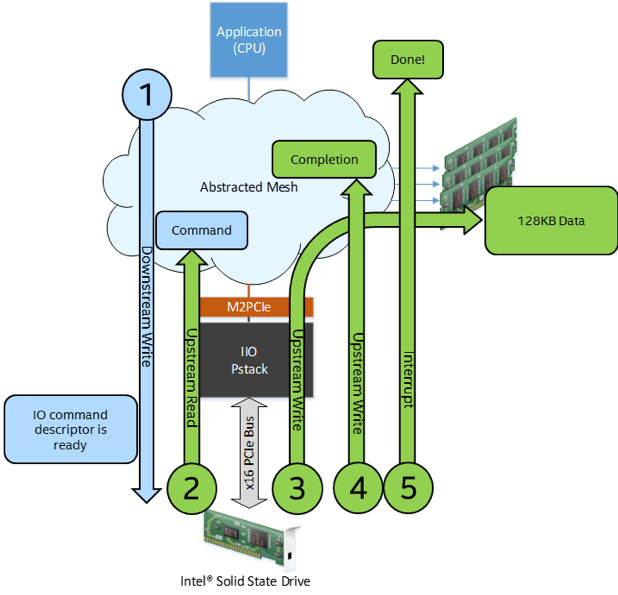
IIO Traffic Flow Example: Read from Disk
In this example, an application reads 128KB of data from the disk but the data migration is accomplished with writes from PCIe, through IIO, to the memory.
- Application reads data from the disk
- CPU writes a command descriptor to the memory.
- CPU does a write to the PCIe SSD controller to notify it that there is a command descriptor in the memory.
- PCIe SSD controller fetches the command descriptor from the memory.
- PCIe SSD controller reads the data from the disk and then WRITES the requested data to the memory.
- PCIe SSD controller writes a completion descriptor to the memory.
- PCIe SSD controller notifies the CPU via an interrupt that the copy is complete.
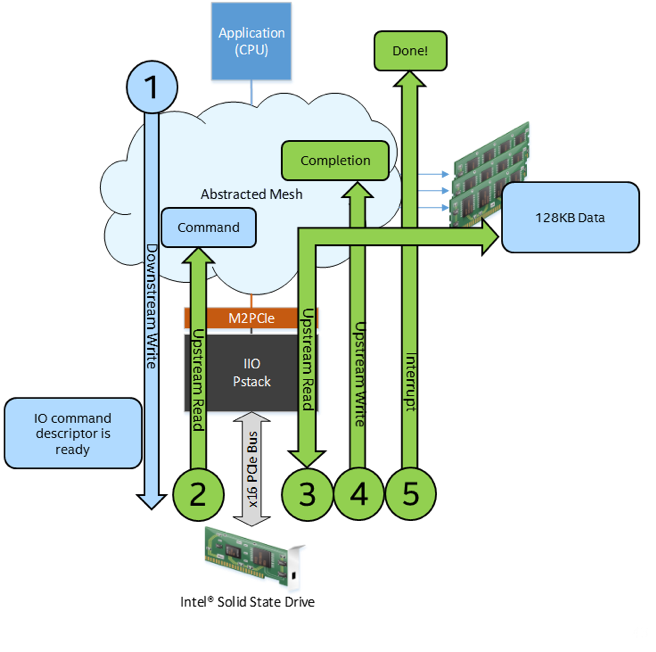
IIO Traffic Flow Example: Write to Disk
In this example, an application writes 128KB of data to the disk but the data migration is accomplished with reads from PCIe, through IIO, to the memory.
- Application writes data to the disk
- CPU writes a command descriptor to the memory.
- CPU does a write to the PCIe SSD controller to notify it that there is a command descriptor in the memory.
- PCIe SSD controller fetches the command descriptor from the memory.
- PCIe SSD controller READS the requested data from the memory and stores it to the disk.
- PCIe SSD controller writes a completion descriptor to the memory.
- PCIe SSD controller notifies the CPU that the copy is complete.
IIO PerfMon
Each IIO stack implements 4, 48 bit counters, providing a capability to concurrently gather stack metrics per IIO. Further granularity is achieved with events that select a particular PCIe lanes with up to x4 PCIe lane granularity. The events select part 0 through part 3 to count possible PCIe parts.
Understanding Parts
IIO PerfMon events utilize “parts” to accommodate various PCI Express lane bifurcation configurations. The figure below maps part 0 through part 3 to possible configurations.
PerfMon events for parts that are not populated will count zero.
The PCIe lane configuration is server board specific and cannot be generalized. Mapping of the IIO stack parts to bus numbers may require experimentation. One method is to run a workload to a single IO target and then observe which IIO stack and part is incrementing.
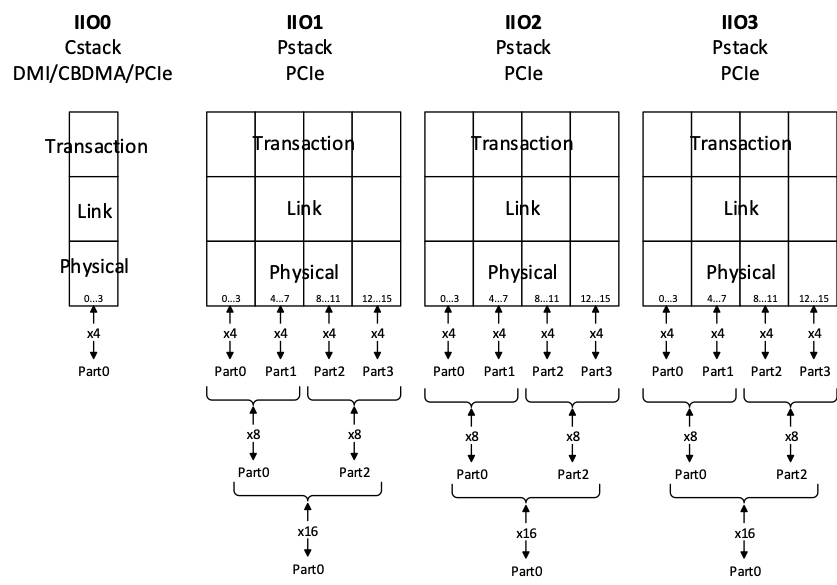
Example 1 (1x16): If the IIO stack connects to a x16 PCI Express device then all the bandwidth for that device will be counted by events with “part0”.
Example 2 (2x8): If the IIO stack connects to 2 x8 PCI Express devices then the bandwidth will be counted by events part0 and part2.
Example 3 (4x8): If the IIO stack connects to 4 x4 PCI Express devices then the bandwidth will be counted by events part0, part1, part2 and part3.
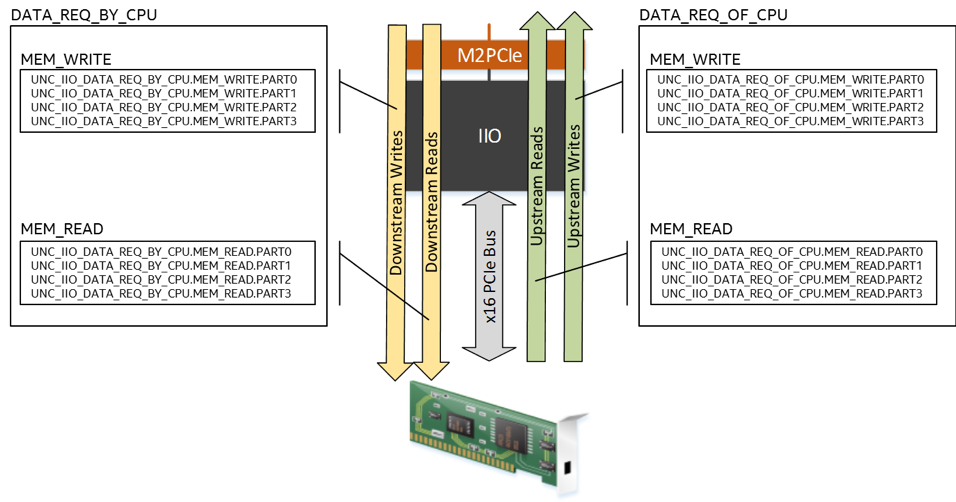
IIO PerfMon Bandwidth Events
The figure below lists the set of events used to count IIO memory bandwidth, mapped to the direction of the traffic that they count. Events increment once for every 4 bytes of data and the bandwidth can be calculated by multiplying the event count by 4 and dividing by the sample time.
MB/S = (event count * 4 bytes / 10^6) / seconds sampled
DATA_REQ_OF_CPU events count bandwidth of transactions targeting the coherent memory and do not increment for peer-to-peer and VTd transactions.
DATA_REQ_BY_CPU events count bandwidth of transactions from a CPU and do not increment for peer-to-peer and VTd transactions.
IIO Performance Analysis with Intel® VTune™ Amplifier
Performance analysis and software optimization have become increasingly challenging due to over-all compute system complexities. Rapidly rising technological advancements of all layers of execution make application performance tuning a very complicated task.
An existing common technique to solve performance related issues is based on the utilization of on-chip Performance Monitoring Units (PMUs).
Traditionally, a performance analysis is mostly focused on the performance counters in CPU cores. However, when configuring a platform with I/O devices or when selecting a platform for I/O usage models, it is equally important to have performance data from the uncore (rest of the processor besides the core), I/O and socket interconnect counters.
Cumulatively, there are more than one thousand performance monitoring events that can help understand microarchitecture activities while running an application.
With Intel VTune Amplifier, you get all these advanced profiling capabilities with a single, friendly analysis interface.
Use Intel VTune Amplifier's Input and Output analysis to analyze PCIe traffic, and identify IO performance issues that may be caused by ineffective accesses to remote sockets, under-utilized throughput of IO device, and others.
Start your analysis with the Summary window that displays overall PCIe performance statistics. Explore the Bandwidth Utilization histogram to understand how long your workload has been under-utilizing PCIe subsystem.
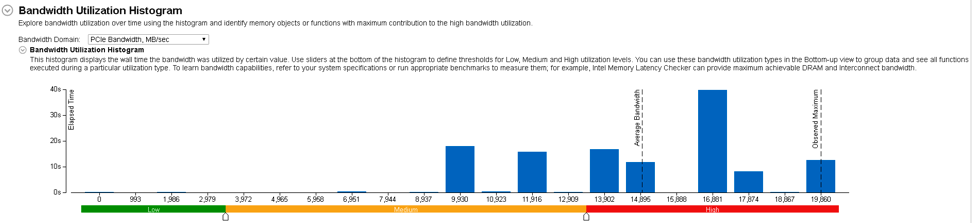
Bandwidth utilization
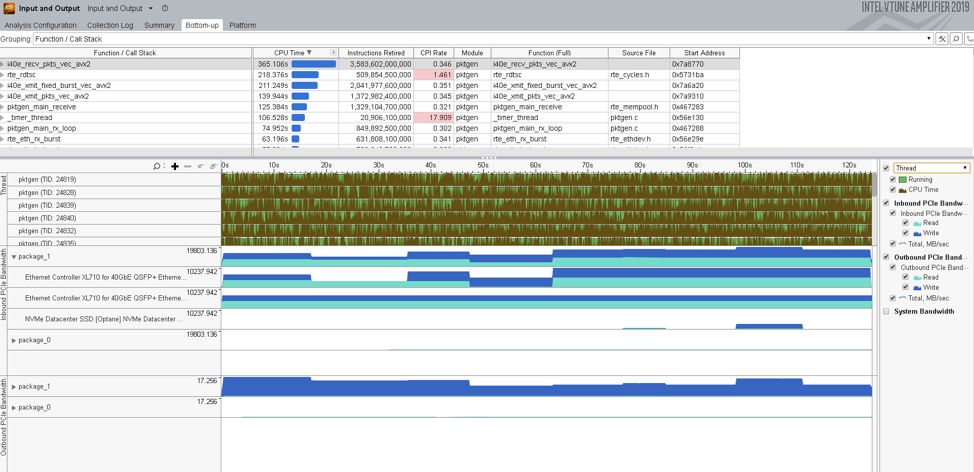
Bottom-up view
Locate an area of recession on the timeline and zoom in to see performance changes for IO communications. Right-click and select the Filter In by Selection menu option, when the Bottom-up view is filtered in, you can apply the Function grouping to the grid and identify functions executed at the selected time frame. Double-click a function with the highest CPU time value to dive to the source view and analyze the code.
Use the Platform window to analyze whether your IO workload is configured properly for a multi-socket system. To do this, switch to the Package/Core/H/W Context grouping on the legend pane to track IO performance per package. The example below illustrates an ineffective IO flow when Storage device and core consuming/producing data belong to different packages. As a result, you see high UPI Bandwidth values, which signals a heavy utilization of the interconnect:
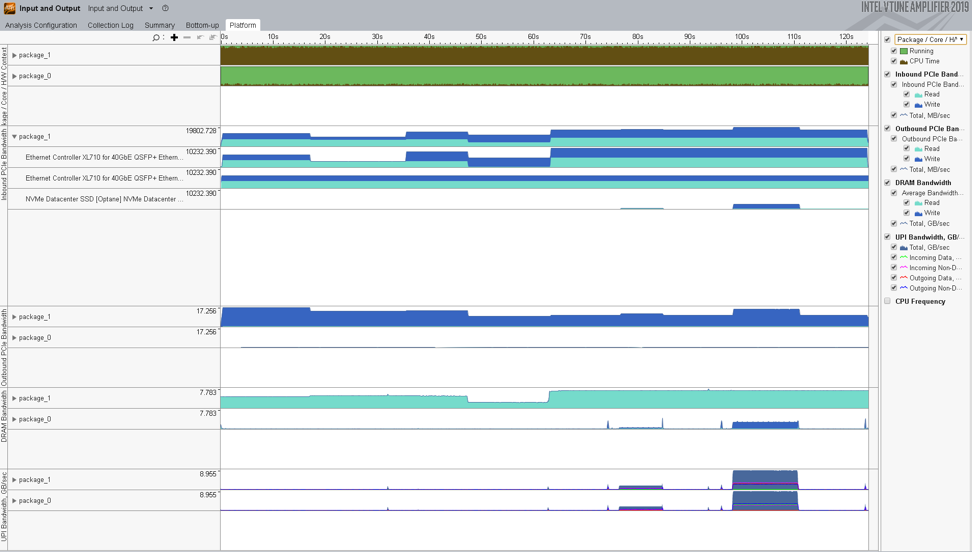
Platform view
Use Hardware Events view point to analyze raw performance counters:
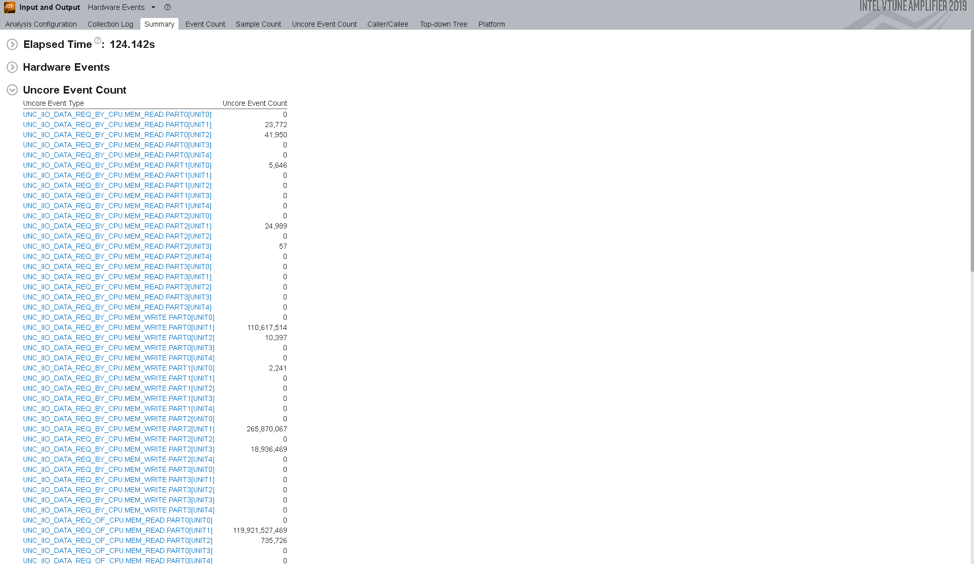
Raw IIO performance counters
Whether you’re tuning for the first time or doing advanced performance optimization, Intel VTune Amplifier provides accurate profiling data, collected with very low overhead.
But good data isn’t enough. Intel VTune Amplifier gives you the tools to mine it and interpret it. Quickly turn raw profiling data into performance insight using the graphical interface to sort, filter, and visualize data from a local or remote target. Or use the command line interface to automate analysis.
Feature availability and details may vary by operating system. For complete information, see the documentation and release note.
Use Intel VTune Amplifier's Input and Output analysis to analyze PCIe traffic, and identify IO performance issues that may be caused by ineffective accesses to remote sockets, under-utilized throughput of IO device, and others.