AN 1006: Multi-Project Analysis with Exploration Dashboard
2.5. Step 5: Analyze the Results of Report Timing
- Under Reports, click Import Analysis Report in the Tasks list. The Import Analysis Report dialog box appears.
Figure 23. Report Timing Task
- For Choose an analysis report to import, select Report Timing and click OK.
Figure 24. Importing Report Timing Report
- Under Analysis type, select Setup, and then type 100 for Report number of paths.
Figure 25. Report Timing Dialog Box Options
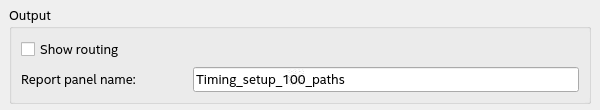
- For Report panel name, specify a custom name. For example, Timing_setup_100_paths.
Figure 26. Custom Report
- Click OK. Exploration Dashboard analyzes the results across each project and creates the Merged report under the Analysis Reports folder in the Report tab.
Figure 27. Timing_setup_100_paths
In the top pane of this report, each row corresponds to a bundle of paths across each project that share a common “From Node” and “To Node” pattern. These patterns generate from the “From Node” and “To Node” fields in each report. Exploration Dashboard performs some report processing, such as replacing specific bus indexes with “*” and stripping Compiler-generated suffixes.
Note: The dashboard only strips bus indices off of the end of the name (that is, individual registers), but not indices in the middle of the name. For a module inside a loop in your RTL, the instance names often have [0], [1], ... in them but since those indexes are in the middle of the name they are not aliased. For example, given three register names such as:foo|bar[1]|baz|reg[0] foo|bar[1]|baz|reg[1]~SUFFIX foo|bar[2]|baz|reg[2]
The dashboard will create two collapsed groups:foo|bar[1]|baz|reg[*] foo|bar[2]|baz|reg[*]
Figure 28. Merged Timing Paths
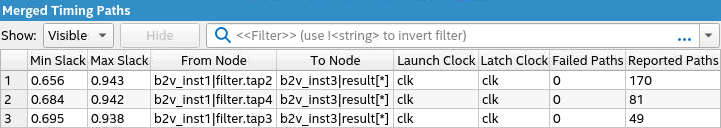
Exploration Dashboard creates bundles of timing results from similarly named nodes within the design, and takes measurements of the bundle, such as Min Slack and Max Slack. In addition, Exploration Dashboard can report the Reported Paths (the total size of the bundle), and the Failing/Passing/Unreported Projects data. These reports identify projects with failing paths, passing paths, and no reported paths in the bundle.
Note: A path may be reported by one project and not another. The more paths you report, the bigger the report gets but the more likely you are to find a given path across all projects in the group. Since the paths are ranked by slack, a given path might have a different slack value between different projects/seeds. To ensure that a path is always reported across each project in the group, you can leverage the from/to/from_clock/to_clock filters in the Report Timing dialog box. By being more specific in your query, rather than just asking for the top critical paths in general, you'll get a more consistent result. - Select a row in the top table to populate the bottom table with the timing data.
Figure 29. Aggregated Report Timing Panel (Lower Tables)
- To access more detail about a given path from a given project, open the Individual Paths results report, and then select the corresponding row in the table. Path detail reports display in the bottom half of the Paths Detail pane, with tabular report data similar to the Timing Analyzer.