AN 1006: Multi-Project Analysis with Exploration Dashboard
ID
816589
Date
9/29/2025
Public
2.1. Step 1: Create an Exploration Dashboard Workspace
2.2. Step 2: Add Projects to Exploration Dashboard
2.3. Step 3: Launch Connections and Compile the Projects
2.4. Step 4: Analyze Timing Summary Reports
2.5. Step 5: Analyze the Results of Report Timing
2.6. Step 6: Disconnecting Interactive Connections
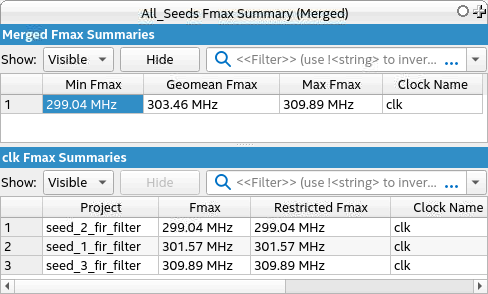
4.3. Report Fmax Summary
The Fmax Summary report consolidates the fMAX data from each project and provides helpful statistics. Select a clock to display in the bottom panel detailed information about each project in the group.
Figure 53. Fmax Summary Report