AN 1006: Multi-Project Analysis with Exploration Dashboard
ID
816589
Date
9/29/2025
Public
2.1. Step 1: Create an Exploration Dashboard Workspace
2.2. Step 2: Add Projects to Exploration Dashboard
2.3. Step 3: Launch Connections and Compile the Projects
2.4. Step 4: Analyze Timing Summary Reports
2.5. Step 5: Analyze the Results of Report Timing
2.6. Step 6: Disconnecting Interactive Connections
4.2. Report Timing Summary
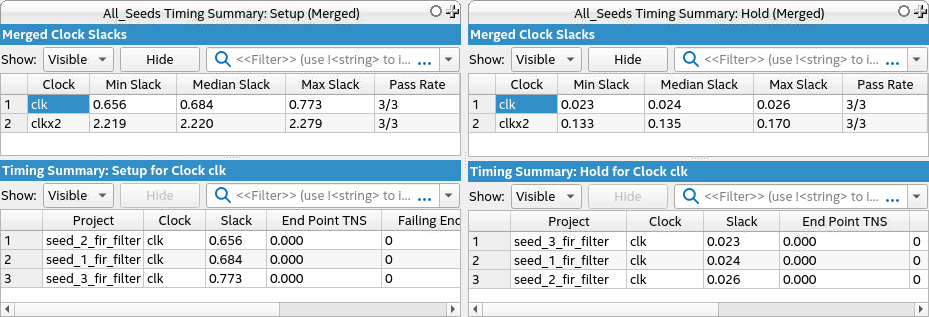
The Report Timing Summary option enables you to analyze consolidated reports of various timing summaries produced for each project. It merges multiple Timing Summaries into a single report, offering insightful information about the projects under review.
Figure 51. Report Timing Summary Options

For each generated report—Setup, Hold, Recovery, or Removal—statistics are provided for each clock in the design. These statistics include Minimum, Median, and Maximum Slack, as well as the Pass Rate, which indicates the proportion of projects within the group that report positive slack, relative to the total number of projects. You can select a clock from the summary to show detailed information about the slack associated with each individual project.
Note: A slack value of 0.000 or higher is regarded as positive.
Figure 52. All Seeds Timing Summary