Multi Channel DMA Intel® FPGA IP for PCI Express User Guide
ID
683821
Date
4/11/2023
Public
A newer version of this document is available. Customers should click here to go to the newest version.
1. Before You Begin
2. Introduction
3. Functional Description
4. Interface Overview
5. Parameters (H-Tile)
6. Parameters (P-Tile) (F-Tile) (R-Tile)
7. Designing with the IP Core
8. Software Programming Model
9. Registers
10. Troubleshooting/Debugging
11. Multi Channel DMA Intel FPGA IP for PCI Express User Guide Archives
12. Revision History for Multi Channel DMA Intel FPGA IP for PCI Express User Guide
3.1. Multi Channel DMA
3.2. Bursting Avalon-MM Master (BAM)
3.3. Bursting Avalon-MM Slave (BAS)
3.4. MSI Interrupt
3.5. Config Slave (CS)
3.6. Root Port Address Translation Table Enablement
3.7. Hard IP Reconfiguration Interface
3.8. Config TL Interface
3.9. Configuration Intercept Interface (EP Only)
3.10. Data Mover Only
4.1. Port List
4.2. Clocks
4.3. Resets
4.4. Multi Channel DMA
4.5. Bursting Avalon-MM Master (BAM) Interface
4.6. Bursting Avalon-MM Slave (BAS) Interface
4.7. MSI Interface
4.8. Config Slave Interface (RP only)
4.9. Hard IP Reconfiguration Interface
4.10. Config TL Interface
4.11. Configuration Intercept Interface (EP Only)
4.12. Data Mover Interface
4.13. Hard IP Status Interface
8.1.6.1. ifc_api_start
8.1.6.2. ifc_mcdma_port_by_name
8.1.6.3. ifc_qdma_device_get
8.1.6.4. ifc_num_channels_get
8.1.6.5. ifc_qdma_channel_get
8.1.6.6. ifc_qdma_acquire_channels
8.1.6.7. ifc_qdma_release_all_channels
8.1.6.8. ifc_qdma_device_put
8.1.6.9. ifc_qdma_channel_put
8.1.6.10. ifc_qdma_completion_poll
8.1.6.11. ifc_qdma_request_start
8.1.6.12. ifc_qdma_request_prepare
8.1.6.13. ifc_qdma_descq_queue_batch_load
8.1.6.14. ifc_qdma_request_submit
8.1.6.15. ifc_qdma_pio_read32
8.1.6.16. ifc_qdma_pio_write32
8.1.6.17. ifc_qdma_pio_read64
8.1.6.18. ifc_qdma_pio_write64
8.1.6.19. ifc_qdma_pio_read128
8.1.6.20. ifc_qdma_pio_write128
8.1.6.21. ifc_qdma_pio_read256
8.1.6.22. ifc_qdma_pio_write256
8.1.6.23. ifc_request_malloc
8.1.6.24. ifc_request_free
8.1.6.25. ifc_app_stop
8.1.6.26. ifc_qdma_poll_init
8.1.6.27. ifc_qdma_poll_add
8.1.6.28. ifc_qdma_poll_wait
8.1.6.29. ifc_mcdma_port_by_name
10.1.4.4.1. Running Eye Viewer in the P-Tile Debug Toolkit
Steps to run Eye Viewer in the P-Tile Debug Toolkit
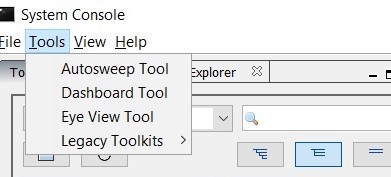
- In the System Console Tools menu option, click on Eye View Tool.
Note: The per-lane information under the Eye Viewer tab corresponds to the physical lanes.Figure 66. Opening the Eye Viewer
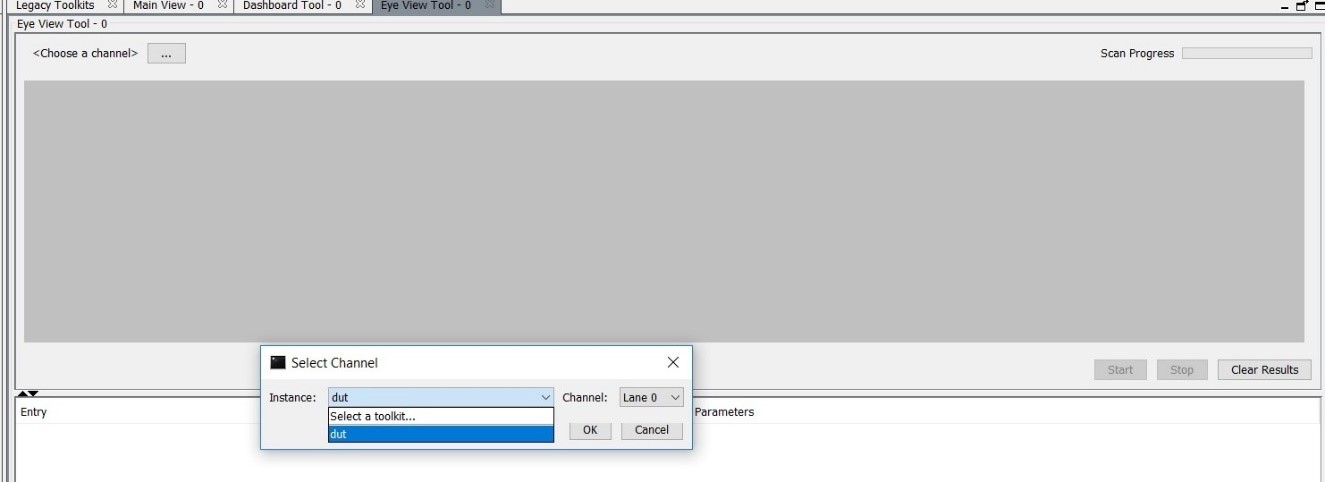
- This will open a new tab Eye View Tool next to the Main View tab. Choose the instance and channel for which you want to run the eye view tests.
Figure 67. Opening the Instance and Channel
- For P-Tile debug toolkit, set the Eye Max BER. Two options are available: 1e-9 or 1e-12.
- Click Start to begin the eye measurement for the selected channel.
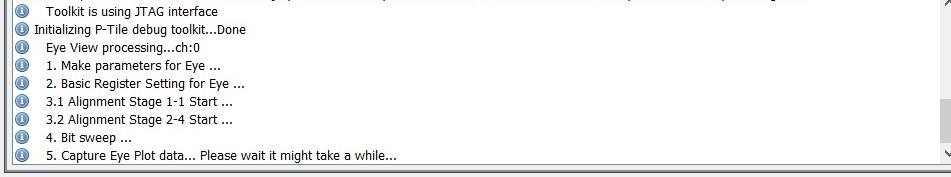
- The messages window displays information messages to indicate the eye view tool's progress.
Figure 68. Eye View Tool Messages
- Once the eye measurement is complete, the eye height, eye width and eye diagram are displayed.
Figure 69. Sample Eye Plot [for BER = 1e-9 in P-Tile debug toolkit]
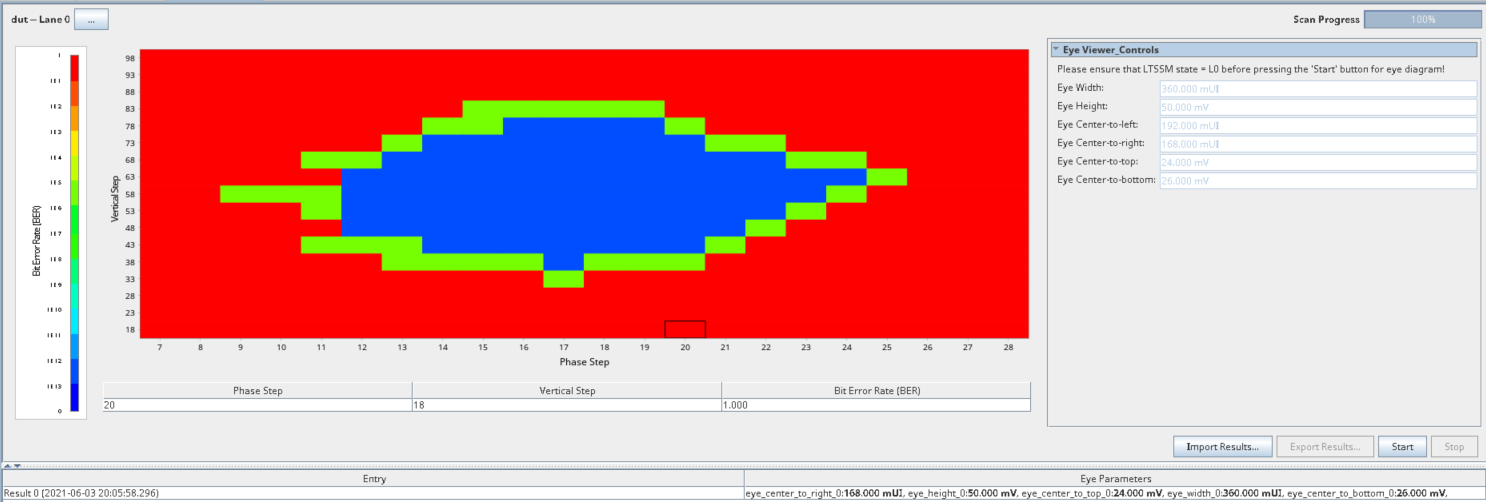 Figure 70. Sample Eye Plot [for BER = 1e-12 in P-Tile debug toolkit]
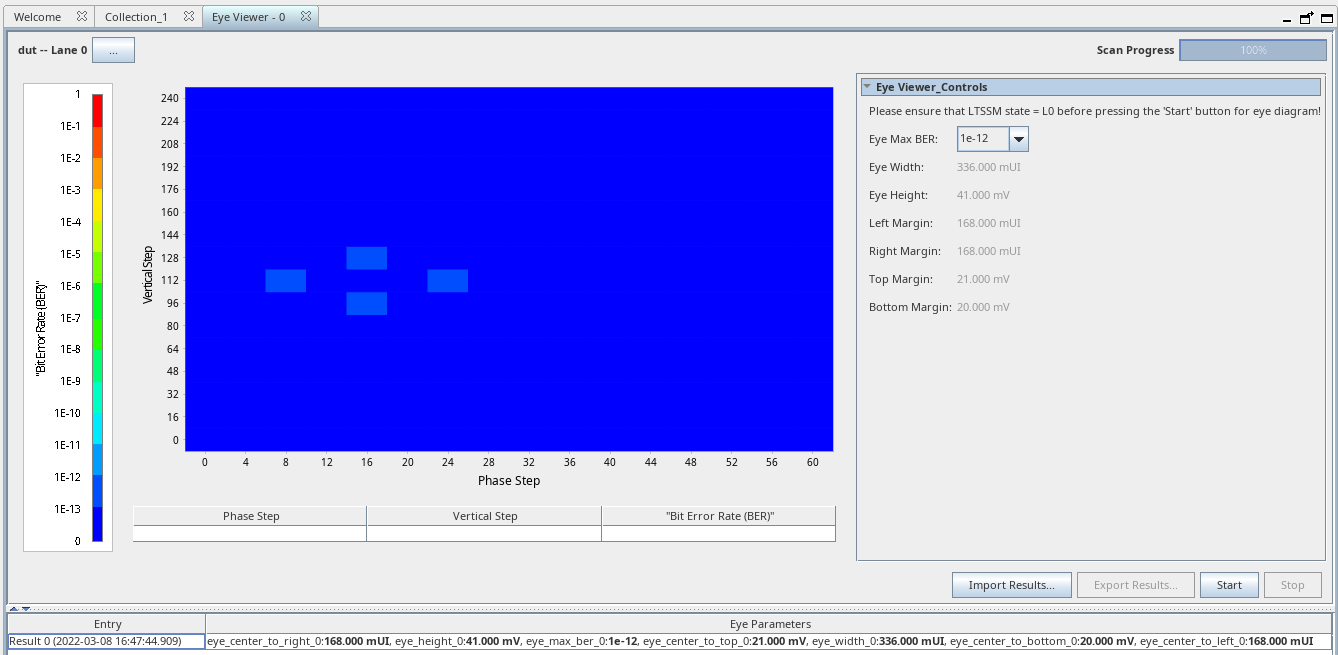 Note: Full eye plot is not drawn for BER = 1e-12.Note: For P-Tile debug toolkit eye margin mask, refer to the P-Tile Avalon Streaming Intel FPGA IP for PCI Express User Guide