A newer version of this document is available. Customers should click here to go to the newest version.
Visible to Intel only — GUID: GUID-58135E00-01AD-4D19-9026-7F9ECFF257FD
Visible to Intel only — GUID: GUID-58135E00-01AD-4D19-9026-7F9ECFF257FD
Profiling JavaScript* Code in Node.js*
This recipe provides configuration steps to rebuild Node.js* and enable Intel® VTune™ Amplifier performance analysis for your JavaScript code including mixed-mode call stacks containing JS frames and native frames (native code, for example, system libraries or native libraries called from the JavaScript code).
Content expert: Denis Pravdin
Ingredients
This section lists the hardware and software tools used for the performance analysis scenario.
Application: sample.js. The application is used as a demo and not available for download.
JavaScript environment: Node.js version 8.0.0 with Chrome* V8 version 5.8.283.41
Performance analysis tools: Intel VTune Amplifier 2018 - Advanced Hotspots analysis
NOTE:Starting with the 2020 release, Intel® VTune™ Amplifier has been renamed to Intel® VTune™ Profiler.
Most recipes in the Intel® VTune™ Profiler Performance Analysis Cookbook are flexible. You can apply them to different versions of Intel® VTune™ Profiler. In some cases, minor adjustments may be required.
Get the latest version of Intel® VTune™ Profiler:
From the Intel® VTune™ Profiler product page.
Download the latest standalone package from the Intel® oneAPI standalone components page.
Operating system: Windows* 10
Enable VTune Amplifier Support in Node.js
Download node.js sources (nightly build).
Run the vcbuild.bat script from the root node-v8.0.0 folder:
echo vcbuild.bat enable-vtuneThis script builds Node.js with the VTune Profiler support to profile JavaScript code.
On Linux* systems, avoid using the enable-vtune flag with the fully-static configure flag. This combination is not compatible and causes the Node.js environment to crash.
If you use Microsoft Visual Studio* 2015 IDE or higher, make sure to add #define _SILENCE_STDEXT_HASH_DEPRECATION_WARNINGS to the node-v8.0.0-win\deps\v8\src\third_party\vtune\vtune-jit.cc file:
#include <string.h>

#ifdef WIN32
#define _SILENCE_STDEXT_HASH_DEPRECATION_WARNINGS
#include <hash_map>
using namespace std;
#else
...
Profile JavaScript Code Running in Node.js
This recipe uses a sample JavaScript application:
function say(word) {
console.log("Calculating ...");
var res = 0;
for (var i = 0; i < 20000; i++) {
  for (var j = 0; j < 20000; j++) {
    res = i * j / 2;
  }
 }
console.log("Done.");
console.log(word);
}

function execute(someFunction, value) {
  someFunction(value);
}

execute(say, "Hello from Node.js!");
Launch the VTune Amplifier:
amplxe-gui.exeClick the New Project
 icon on the toolbar to create a new project.
 In the Analysis Target tab, specify node.exe in the Application field and sample.js in the Application parameters field:
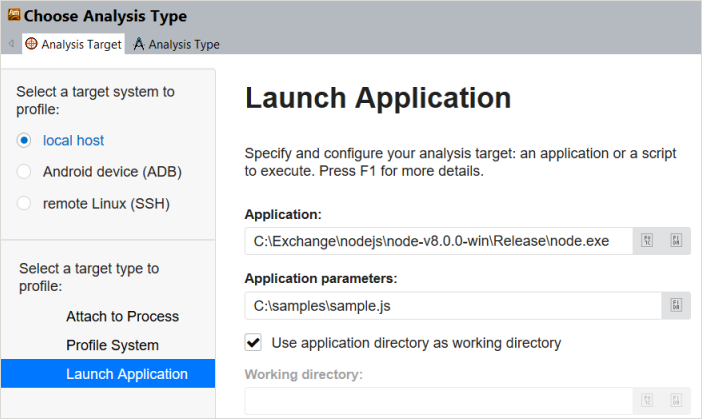
Switch to the Analysis Type tab and select the Advance Hotspots analysis type from the left pane and click Start to run the analysis.
NOTE:Advanced Hotspots analysis was integrated into the generic Hotspots analysis starting with Intel VTune Amplifier 2019, and is available via the Hardware Event-Based Sampling collection mode.
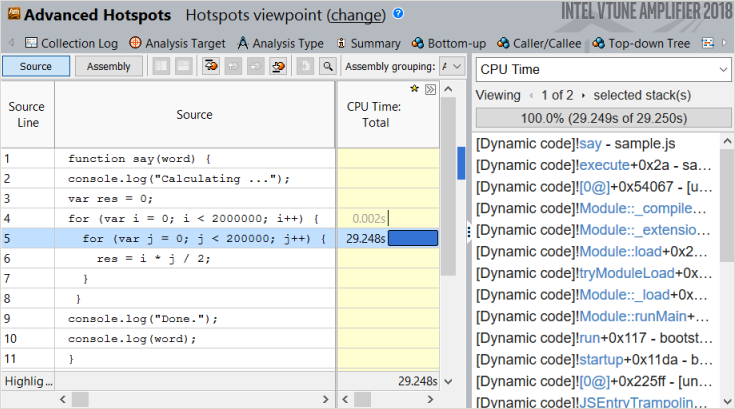
When the analysis is complete, the VTune Amplifier opens the result in the default Hotspots viewpoint. Use the Bottom-up window to explore how the samples are distributed through JavaScript functions. Double-click the function that took the most CPU time to execute to view the source code and identify the hottest code line: