Using the Command-Line Interface to Analyze the Performance of a SYCL* Application running on a GPU (NEW)
This recipe illustrates how you use the command-line interface (CLI) in Intel® VTune™ Profiler to analyze the performance of a SYCL application offloaded on an Intel GPU. The recipe also describes how you can customize your report with collected data.
Content expert: Egor Suldin, Mariya Petrova
Intel® VTune™ Profiler provides a command line interface (the vtune tool) for remote analysis, scripted commands, and performance regression checks to monitor software performance over time. The vtune command line interface (CLI) provides an extensive set of options with which you can perform almost every task that is possible through the GUI. You can initiate analysis via the command line (running it as a background task or on a remote system) and then view the result or generate a report.
This recipe explores how you can use the CLI efficiently to generate reports on hotspots for these purposes:
Explore hotspots on the CPU/GPU side by running gpu-offload and gpu-hotspots analyses.
View the hottest GPU computing tasks annotated with:
- Execution time
- Data transfers
- Working group sizes
- SIMD width
- Average GPU hardware metrics
Generate Source/Assembly code views to analyze instructions that possibly contributed to performance issues.
Here are the ingredients and instructions you need to explore efficient CLI use for GPU performance analysis.
Ingredients
Here are the minimum hardware and software requirements for this performance analysis.
Application: matrix_multiply_vtune. This sample application is available as part of the code sample package for Intel® oneAPI toolkits.
Compiler: To compile a SYCL application, you need the Intel® oneAPI DPC++/C++ Compiler (icpx -fsycl) that is available with the Intel® oneAPI Base Toolkit.
Tools: Intel® VTune™ Profiler 2021 - GPU Offload and GPU Compute/Media Hotspots Analyses.
NOTE:Starting with the 2020 release, Intel® VTune™ Amplifier has been renamed to Intel® VTune™ Profiler.
Most recipes in the Intel® VTune™ Profiler Performance Analysis Cookbook are flexible. You can apply them to different versions of Intel® VTune™ Profiler. In some cases, minor adjustments may be required.
Get the latest version of Intel® VTune™ Profiler:
From the Intel® VTune™ Profiler product page.
Download the latest standalone package from the Intel® oneAPI standalone components page.
Microarchitecture:
Intel® Iris® Pro Graphics 580
Intel microarchitecture codenamed Skylake S
Operating system:
Ubuntu 20.04 LTS
Build and Compile the SYCL Application
Go to the sample directory.
cd <sample_dir>/VtuneProfiler/matrix_multiply_vtune
The multiply.cpp file in the src directory contains several versions of matrix multiplication. Select a version by editing the corresponding #define MULTIPLY line in multiply.hpp.
Compile your sample application:
cmake . && make
This command generates a matrix.icpx -fsycl executable.
To delete the program, type:
make clean
This command removes the executable and object files that were created by the make command.
Ensure Prerequisites for GPU Analyses
Complete these steps before you run the GPU Offload Analysis or the GPU Compute/Media Hotspots Analysis.
Prepare the system to run a GPU analysis. See Set Up System for GPU Analysis.
Set up environment variables for Intel software tools:
source $ONEAPI_ROOT/setvars.sh
Run GPU Offload Analysis on the SYCL Application
Use the GPU Offload Analysis as a starting point to identify if an application is CPU or GPU bound. Explore GPU offload efficiency through data transfer analysis and find performance-critical kernels for further analysis and optimization.
In the CLI, type:
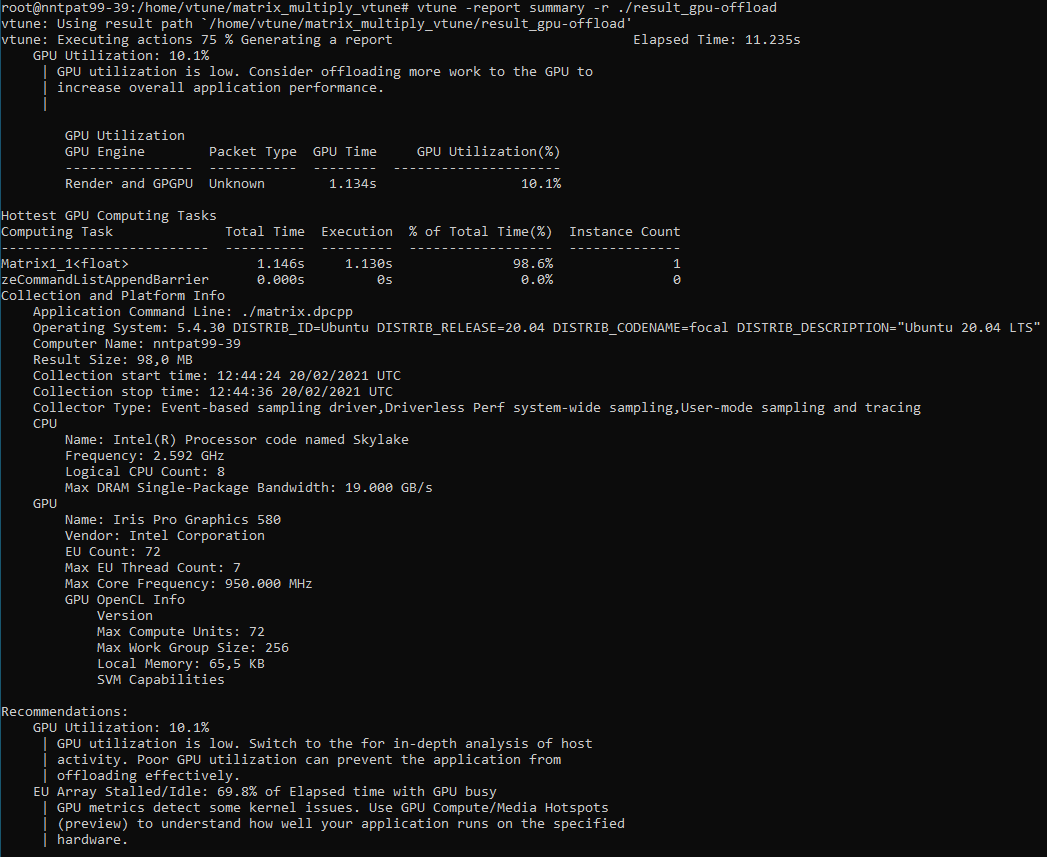
vtune -collect gpu-offload -r ./result_gpu-offload -- ./matrix.icpx -fsyclBy default, VTune Profiler generates a summary report after collecting data. This report includes information on the following fields:
- Elapsed time
- GPU utilization information
- Information about the hottest computing tasks
- Recommendations
To see the summary report, type:
vtune -report summary -r ./result_gpu-offload
If you do not need to see the summary report immediately after data collection, change this setting with the -no-summary option:
vtune -collect gpu-offload -no-summary -r ./result_gpu-offload -- ./matrix.icpx -fsycl
Generate Additional Reports to View Collected Data
CPU Hotspots Report
This report displays a list of executed functions with CPU Time metrics, module names, source file paths and other parameters. The report also lists the hottest program units, starting with the most performance-critical unit. Use the -column, -filter, and -limit options to sort data into a tabular view:
vtune -report hotspots -r ./result_gpu-offload

CPU Hotspots Report Filtered by Module and Grouped by Function
Use the -filter option to focus on a specific part of report like a particular module. You can then use -group-by option to group results in a specific sequence.
vtune -report hotspots -r ./result_gpu-offload -group-by=function -filter module=matrix.icpx -fsycl -q

You can group the generated data in several ways like function name, module, source file path, or computing task.
To see available groupings for a specific result, type:
vtune -report hotspots -r ./result_gpu-offload -group-by=?
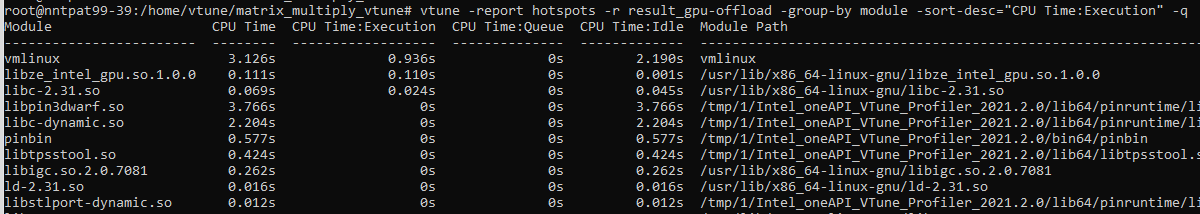
CPU Hotspots Report Sorted by Order
Use the sort-desc and sort-asc options to sort specific information about hotspots in descending or ascending order. You can specify an order for up to three columns.
vtune -report hotspots -r result_gpu-offload -group-by module -sort-desc="CPU Time:Execution" -q
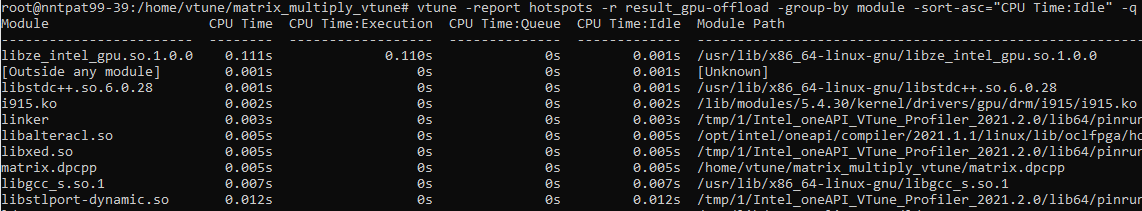
Here is another example:
vtune -report hotspots -r result_gpu-offload -group-by module -sort-asc="CPU Time:Idle" -q
To see available columns for a specific result, type:
vtune -report hotspots -r ./result_gpu-offload -column=?
The report data can contain such columns as CPU Time:Self, Module, and Source File.
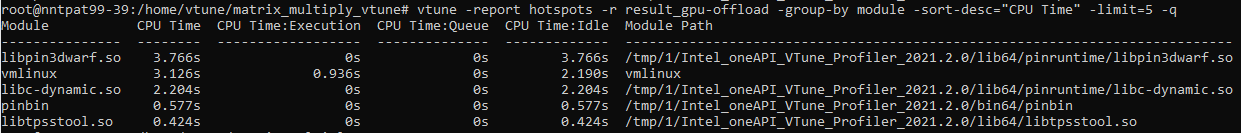
Report of Top 'n' Time-Intensive Program Modules
Use the limit option to see information about the top 'n' hotspots. For example, to understand details about the top five time-intensive program modules in your application, type:
vtune -report hotspots -r result_gpu-offload -group-by module -sort-desc="CPU Time" -limit=5 -q
Hotspots Report Grouped by Computing Task (offloaded on GPU) with Transfer Columns
This command displays hotspots information grouped by GPU computing task and also lists details about transfer sizes and transfer times between CPU and GPU:
vtune -report hotspots -r ./result_gpu-offload -group-by=computing-task -column=Transfer -q
The report contains data transfers that are attributed to the respective computing task.

Hotspots Report Grouped by GPU Offload Computing Task and Time Columns
This command displays hotspots information grouped by offload computing tasks and also lists details about transfer times between CPU and GPU:
vtune -report hotspots -r ./result_gpu-offload -group-by=computing-task-offload -column='Time' -q

Run GPU Compute/Media Hotspots Analysis
Our next step is to run the GPU Compute/Media Hotspots analysis. This analysis can help us to further explore performance improvements for the GPU-bound application or its stages.
In the CLI, type this command to run the analysis:
vtune -collect gpu-hotspots -r ./result_gpu-hotspots -- ./matrix.icpx -fsycl
To see the summary report, type:
vtune -report summary -r ./result_gpu-hotspots

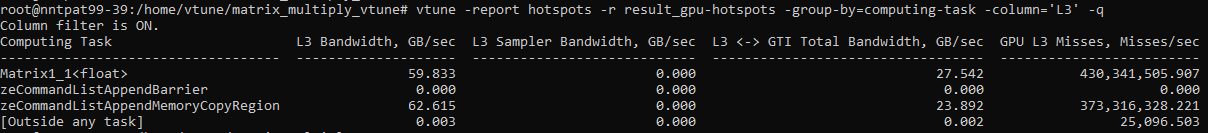
Use this command to generate a report that lists only L3 metrics for computing tasks:
vtune -report hotspots -r result_gpu-hotspots -group-by=computing-task -column='L3' -q
Run the GPU Compute/Media Hotspots Analysis in the Characterization mode to collect data on dynamic instruction count and SIMD utilization:
vtune -collect gpu-hotspots -knob characterization-mode=instruction-count -r ./result_gpu-hotspots_inst-count -- ./matrix.icpx -fsycl
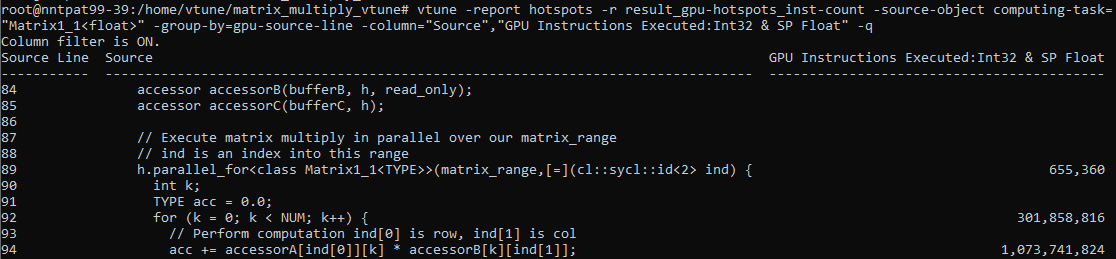
Source Code for Specific Computing Tasks
Use this command to get the source code for a specific computing task:
vtune -report hotspots -r result_gpu-hotspots_inst-count -source-object computing-task="Matrix1_1<float>" -group-by=gpu-source-line -column="Source","GPU Instructions Executed:Int32 & SP Float" -q
Assembly Code for Specific Computing Tasks
Use this command to get the assembly code for a specific computing task:
vtune -report hotspots -r result_gpu-hotspots_inst-count -source-object computing-task="Matrix1_1<float>" -group-by=address -limit=5 -q

Save Report as CSV File
Use the -report-output option to save the generated report as a file. To specify the generation of a .csv report, use -format and -csv-delimiter options:
vtune -report hotspots -r result_gpu-hotspots_inst-count -source-object computing-task="Matrix1_1<float>" -group-by=address -limit=5 -report-output=result.csv -format=csv -csv-delimiter=comma -q

Run Custom Analysis with GPU Programming API Statistics
To get a focused analysis of timing and statistics related to GPU compute kernels, follow the GPU Compute/Media Hotspots analysis with a custom analysis that collects GPU Programming API statistics.
The kernel data available through this collection is similar to the data you collect when running the CLIntercept tool (with DevicePerformanceTiming option enabled) and with the nvprof tool in Summary mode.
In the command line, type:
vtune -collect-with runss -knob collect-programming-api=true -no-summary -r ./result_gpu-programming-api -- ./matrix.icpx -fsycl
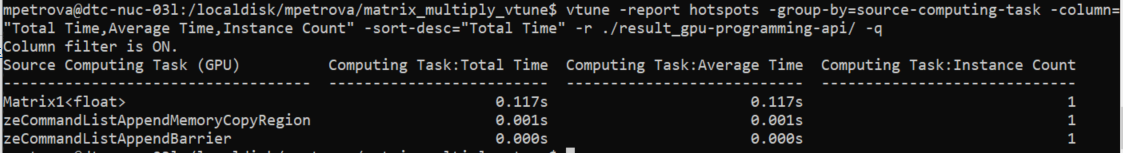
This command generates a report that lists timings and instance count for computing tasks. The data is sorted by Total Time in descending order.
vtune -report hotspots -group-by=source-computing-task -column="Total Time,Average Time,Instance Count" -sort-desc="Total Time" -r ./result_gpu-programming-api/ -q
Discuss this recipe in the VTune Profiler developer forum.