A newer version of this document is available. Customers should click here to go to the newest version.
Visible to Intel only — GUID: GUID-163A3A36-DEF1-4893-A7E8-4DE217CEF483
Visible to Intel only — GUID: GUID-163A3A36-DEF1-4893-A7E8-4DE217CEF483
Profiling an FPGA-driven SYCL* Application
Use this recipe to profile an FPGA-driven SYCL application. The recipe features the AOCL Profiler integrated in the CPU/FPGA Interaction (preview) analysis type in Intel® VTune™ Profiler.
Content expert: Dmitry Ryabtsev
Ingredients
Here are the minimum hardware and software requirements for this performance recipe.
Application: crr. This sample FPGA design is available in the repository for Intel® oneAPI DPC++ Compiler samples.
Compiler: To profile a SYCL application, you need the dpcpp compiler that is available with Intel® oneAPI toolkits.
Tools:
- Intel® VTune™ Profiler - CPU/FPGA Interaction (preview) Analysis
NOTE:
Starting with the 2020 release, Intel® VTune™ Amplifier has been renamed to Intel® VTune™ Profiler.
Most recipes in the Intel® VTune™ Profiler Performance Analysis Cookbook are flexible. You can apply them to different versions of Intel® VTune™ Profiler. In some cases, minor adjustments may be required.
Get the latest version of Intel® VTune™ Profiler:
From the Intel® VTune™ Profiler product page.
Download the latest standalone package from the Intel® oneAPI standalone components page.
Operating system: Linux* OS (Ubuntu* 18.04)
CPU: Intel server platform code-named Cascade Lake
FPGA: Intel® Programmable Acceleration Card (Intel® PAC) with Intel® Arria® 10 GX FPGA or Intel® Stratix 10 GX FPGA PAC board for SYCL (with installable add-on)
Install and Configure the Toolkit
Plug the Intel PAC card into the PCIe slot on the machine.
Download and install Intel® oneAPI Base Toolkit for Linux. Select all default options and either the online or offline installer.
Unzip the FPGA add-on package and run setup.sh. Select all default options.
Set up the oneAPI environment.
source <oneAPI-install-dir>/setvars.sh
Install the FPGA board.
aocl install
Run the diagnose command to ensure that all diagnostics pass.
aocl diagnose
Build the Sample Application
Download code samples from the repository for Intel oneAPI DPC++ Compiler samples.
git clone https://github.com/intel/BaseKit-code-samples.git
Open the crr sample folder.
cd BaseKit-code-samples/FPGAExampleDesigns/crr
Open the src/CMakeLists.txt file.
Locate the line of code that lists hardware flags. It should start with set(HARDWARE_LINK_FLAGS.
Add -Xsprofile to the set of flags.
Go back to the main directory for the sample. Create a new folder called build and open it.
mkdir build
cd build
Compile the sample.
cmake ..
make fpga
This process can take several hours. Once it has finished, you should have an executable file called crr.fpga.
You can now run crr.fpga on FPGA hardware.
Run CPU/FPGA Interaction Analysis
Open Intel® VTune™ Profiler and click New Project on the Welcome screen.
The Create a Project dialog box opens.
Specify a project name, a location for your project, and click Create Project.
The Configure Analysis window opens.
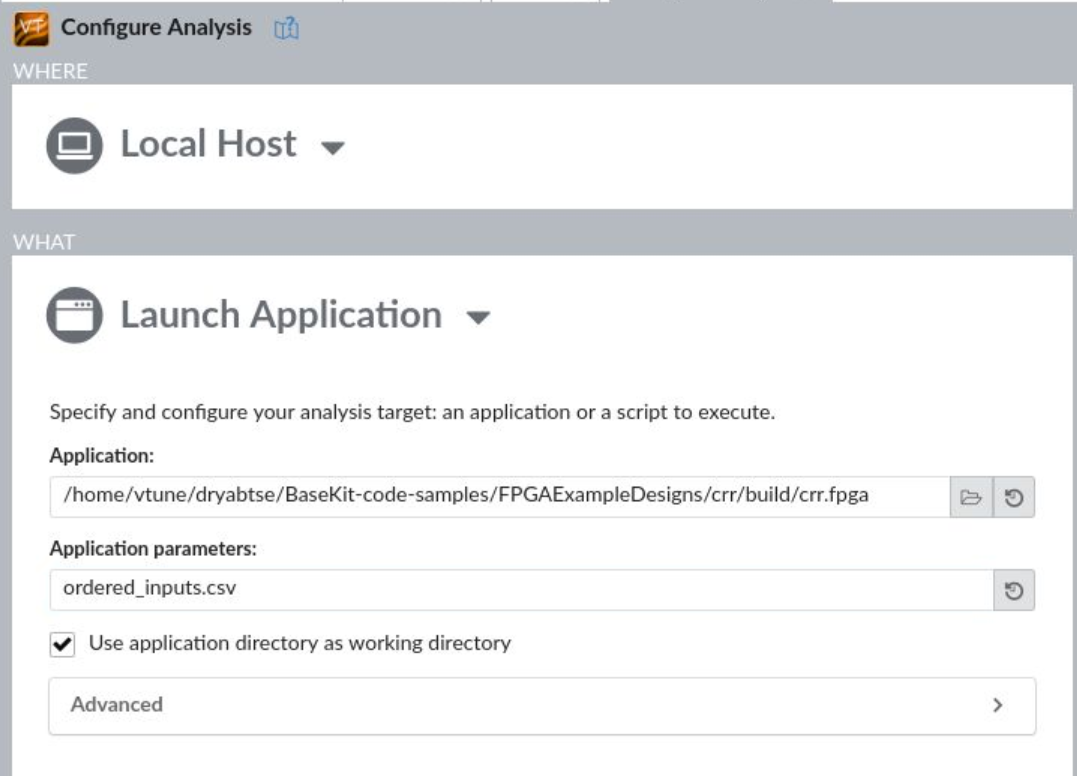
In the WHERE pane, select Local Host.
In the WHAT pane, select Launch Application as the target.
In the Application field, specify the path to the crr.fpga executable.
In the Application parameters field, enter ordered_inputs.csv.
In the HOW pane, select CPU/FPGA Interaction (preview) from the Platform Analysis group.
In the analysis settings, select AOCL Profiler for the FPGA profiling data source.
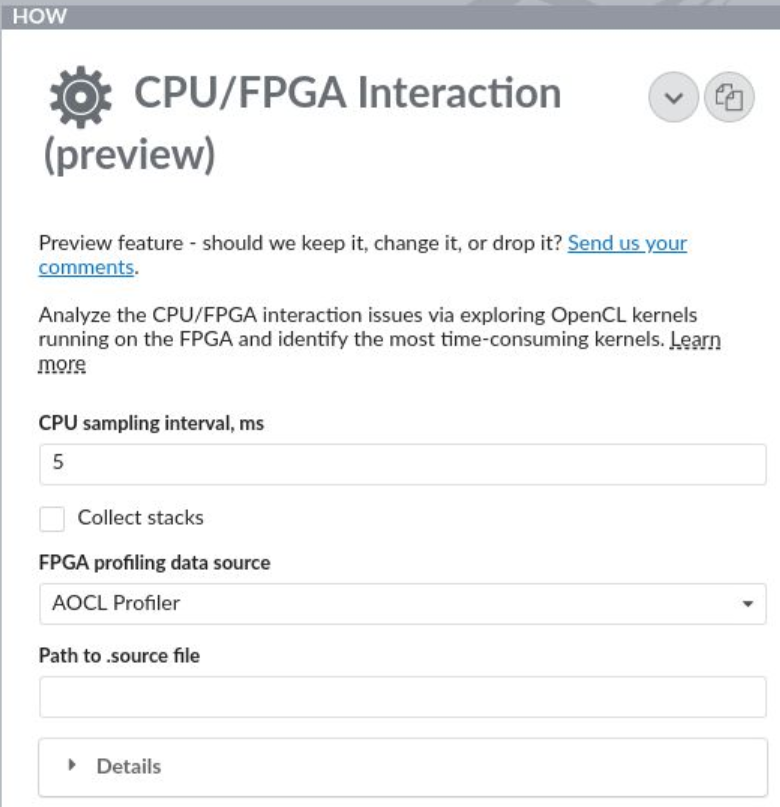
- Click Start at the bottom to run the analysis.
Analyze Results
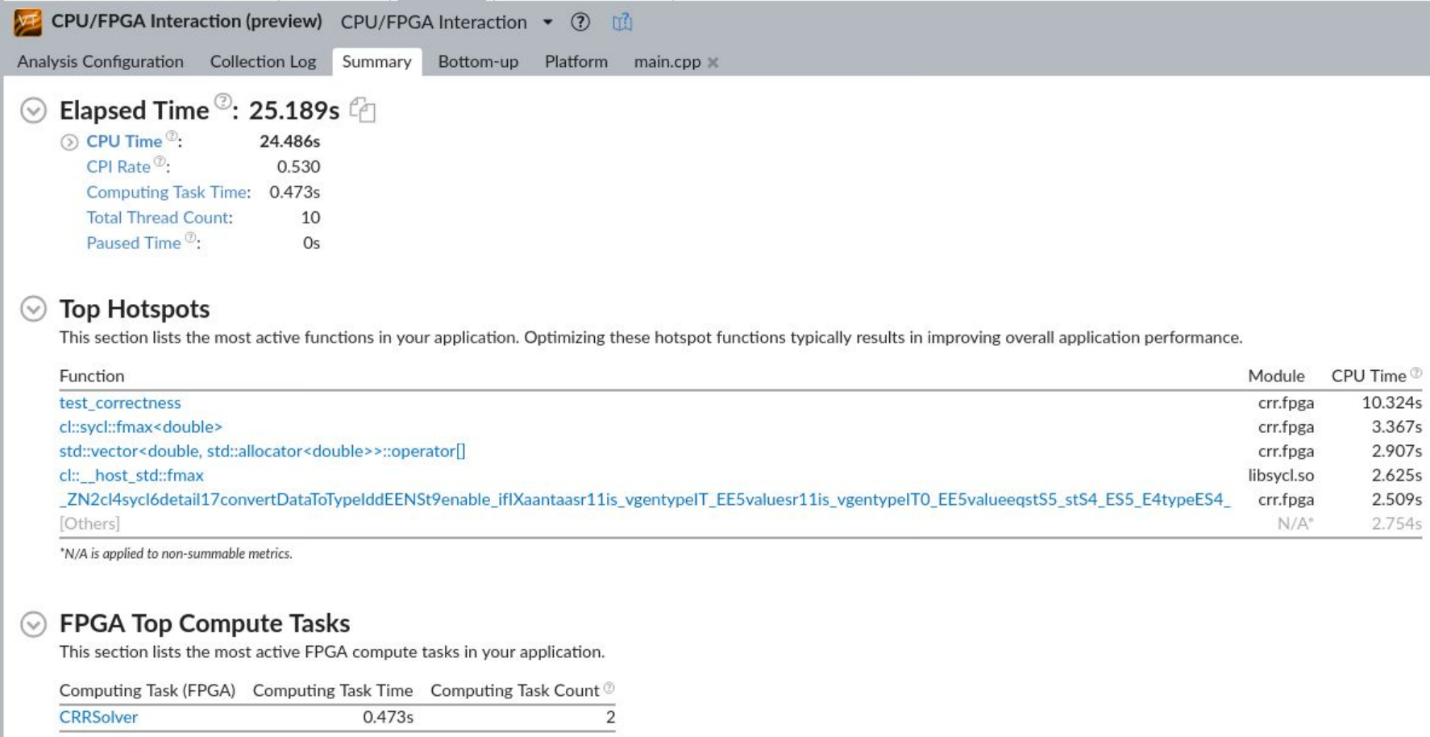
Once data collection completes, you can see the finalized results in the CPU/FPGA Interaction viewpoint. Start with the Summary window to view these details:
FPGA top compute tasks
Top tasks and hotspots for the CPU
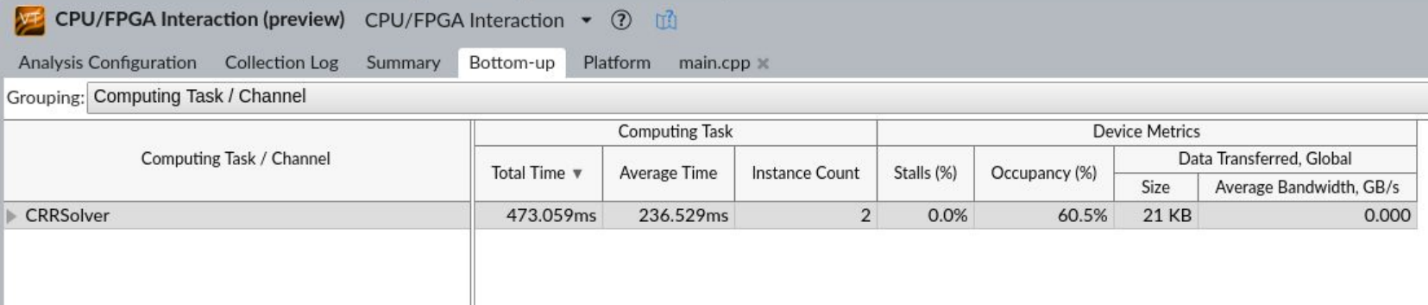
Switch to the Bottom-up window to see detailed information at the kernel level including:
- Stalls
- Occupancy
- Data transfer size
- Average bandwidth for transferred data
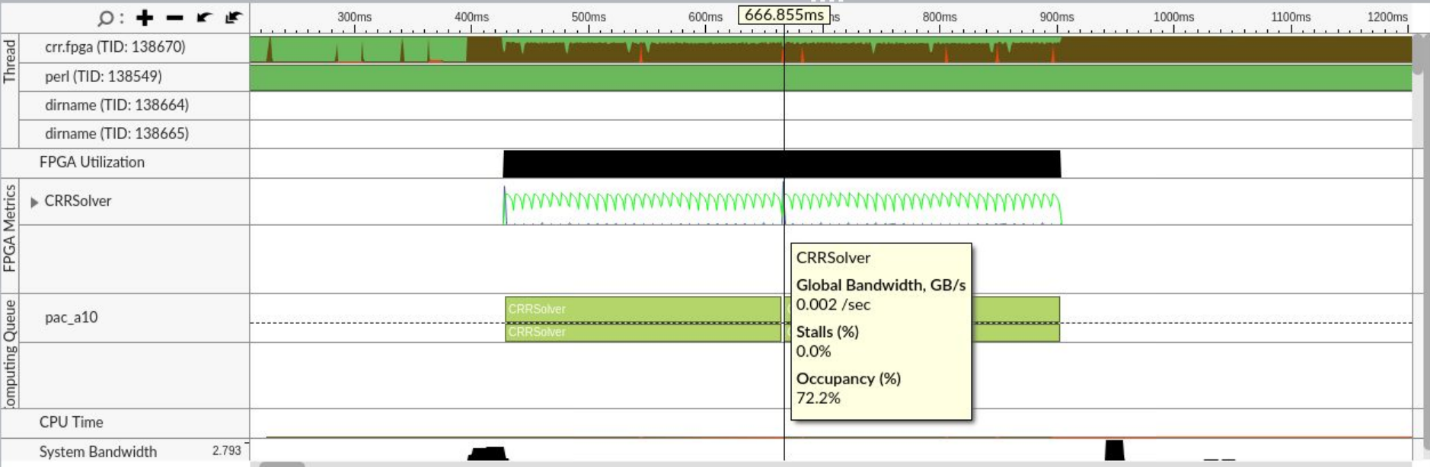
Use the timeline view to see these details about kernel instances:
- Start/end times
- Overtime stalls
- Occupancy
- Bandwidth metrics
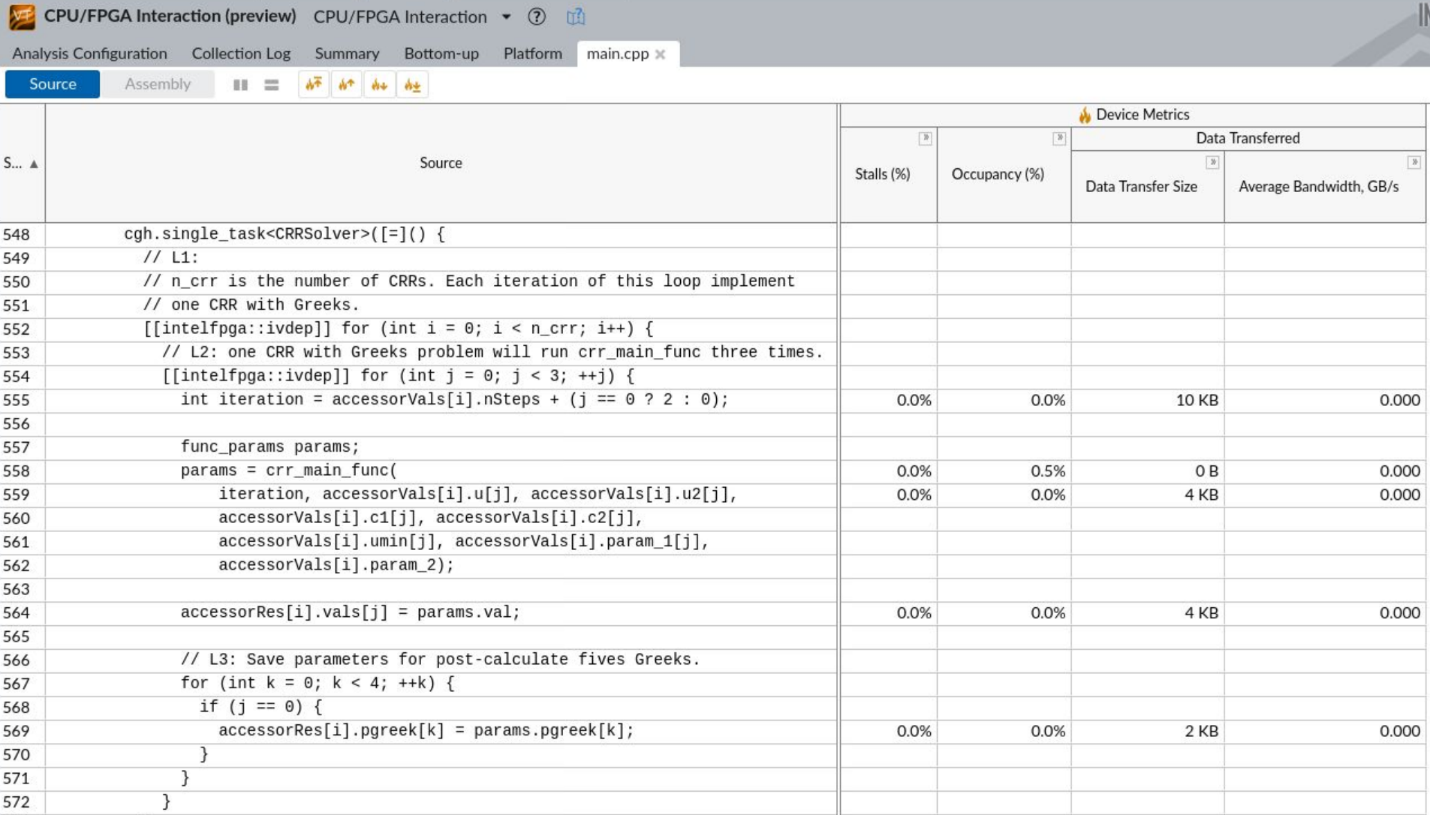
In the Bottom-up window, right-click on a kernel and select View Source from context menu.
This opens the Source View, where you can see metrics for specific kernel source lines.