A newer version of this document is available. Customers should click here to go to the newest version.
Option 3: Run Intel® VTune™ Profiler on the Host to Profile Your Target Application in a Container
Run Intel® VTune™ Profiler on the host system to profile native or Java* applications running in an LXC*, Docker, Mesos*, or Singularity* container on a Linux system.

Prerequisites
In this setup, VTune Profiler automatically detects an application running in the container. You do not need to configure the container for this purpose. However, to run user-mode sampling analysis types (Hotspots or Threading), make sure to run the container with support for ptrace enabled:
host> docker run --cap-add=SYS_PTRACE -td myimageYou can also run the container in the privileged mode:
host> docker run --privileged -td myimageConfigure and Run an Analysis for a Container Target
Choose from one of these target and analysis types:
Target Type |
Analysis Type |
|---|---|
|
|
Create a VTune Profiler project on the host system.
In the WHERE pane, select:
- Local Host system to start analysis from your host Linux system
- Remote Linux (SSH) to start analysis from a remote Linux system connected to your host system via SSH. For remote Linux targets, make sure to configure SSH connection.
In the WHAT pane, specify your analysis target (Attach to Process or Profile System).
Configure your process or system target using available configuration options.
NOTE:In the Profile System mode, VTune Profiler profiles all applications running in the same container or in different containers simultaneously. So, the standard limitation for the system-wide profiling of the managed code is not applicable to Java applications running in the containers.
You can attach the VTune Profiler running under the superuser account to a Java process or a C/C++ application with embedded JVM instance running under a low-privileged user account. For example, you may attach the VTune Profiler to Java based daemons or services.
NOTE:The dynamic attach mechanism is supported only with the Java Development Kit (JDK).
In the HOW pane, select an analysis type. Customize any analysis options you may need.
NOTE:The Hotspots (hardware event-based sampling mode) and Microarchitecture Exploration analyses are configured to use driverless data collection based on the Linux Perf* tool to gather performance data for targets running in a container.
Click Start to launch the analysis.
Alternatively, you can configure and run any of these analyses using the VTune Profiler command line interface (vtune). For example, to run a system-wide Hotspots analysis locally, enter:
host> vtune -collect hotspots -knob sampling-mode=hw -analyze-system -d 60To run Hotspots analysis in the Attach to Process mode on a remote system, enter:
host> vtune -target-system=ssh:user1@172.16.254.1 -collect hotspots -knob sampling-mode=hw -target-process=java -d 60View Data
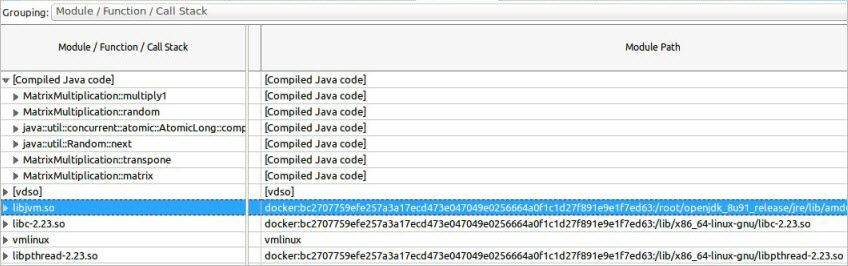
The collected result opens in the default Hotspots viewpoint, where paths to container modules show up with prefixes (for instance, docker or lxc):