A newer version of this document is available. Customers should click here to go to the newest version.
Deploy the Intel® VTune™ Profiler Agent
Learn how to deploy the Intel® VTune™ Profiler Agent on remote targets when you use Intel® VTune™ Profiler Server in the web server configuration.
When you use VTune Profiler Server in the web server with remote targets configuration, you must install the VTune Profiler Agent on the remote targets. You can deploy the Agent automatically or manually.
Deploy the VTune Profiler Agent Automatically
VTune Profiler Server uses SSH for automated agent deployment. Running an SSH server on the target machine is necessary for automated deployment.
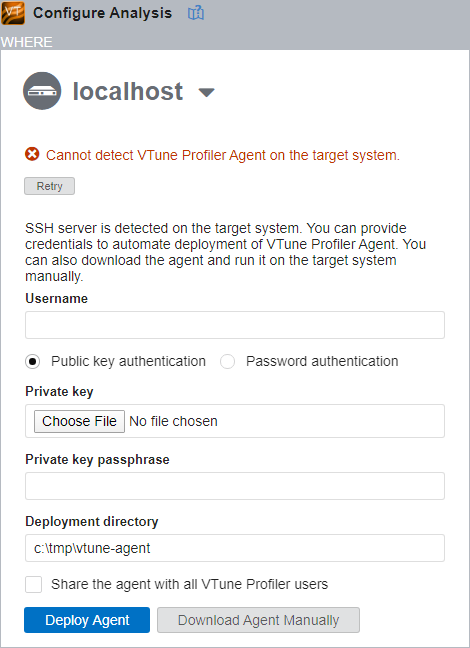
To deploy the Agent automatically:
Enter the target machine username.
Enter the credentials for target machine:
For Public key authentication, add your public SSH key to the authorized_keys file on the target system for the user account that you specify in the Username field. Then, select the Private key file on your client machine. If your private key is encrypted, specify the Private key passphrase.
- Alternatively, switch to Password authentication and provide the username and password.
Optionally, specify the deployment directory.
Click the Deploy Agent button.
Deploy the VTune Profiler Agent Manually
To deploy the Agent manually:
Click the Download Agent Manually button In the WHERE pane of the Configure Analysis window or access the http://<VTune Profiler Server URL>/api/collection-agent/download URL to download the Agent.
NOTE:You can use tools like wget to download the Agent directly to the target system.
Extract the Agent archive with your tool of choice and copy its contents to the target system.
Run the vtune-agent executable on the target system. Specify the agent owner using the -owner <vtune-user-id> option.
NOTE:You can find your VTune Profiler user ID in the About dialog.
Compare the Agent key fingerprint in the WHERE pane of the Configure Analysis window with the fingerprint printed out by the agent upon startup. If they match, click the Admit Agent button.
Shared Agents
When you run a shared VTune Profiler Agent, the Agent is available to all users of an instance of VTune Profiler Server. This means that any user of this VTune Profiler Server instance can run data collection using this agent. Make sure to use dedicated faceless accounts when you run shared agents.
To deploy a shared agent, in the WHERE pane of the Configure Analysis dialog, check the Share the agent with all VTune Profiler users checkbox.
You can also use the --shared command line option when deploying an agent manually.
Select a Client System
A client system is the same machine that you use to access VTune Profiler Server through a web browser. To profile a client system:
Click New Project and specify a name for the new project.
VTune Profiler opens the project configuration with your localhost pre-selected as a target system.
Configure your analysis target and analysis type.
Select a Remote System
To profile a remote target system:
In the WHERE pane of the Configure Analysis window, click the
 down arrow to see available target systems.
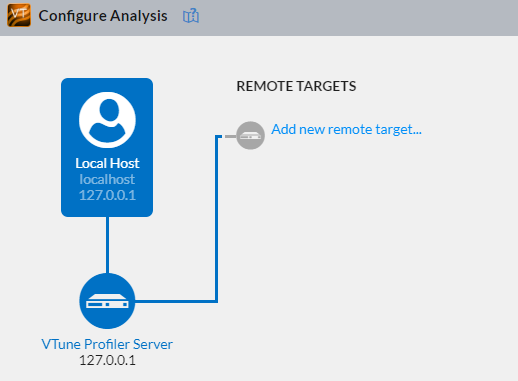
Select Add new remote target....
NOTE:VTune Profiler maintains a list of used remote systems, if any, and displays this list under Remote Targets.
Enter the hostname or IP address.

Run the Analysis
Once the Agent is running, the Configure Analysis pane displays information that VTune Profiler is detecting the device configuration.
The Agent downloads the collectors and the target package, which is approximately 100MB in size. Once the target package is downloaded, the Agent analyzes the target system configuration and displays the applicable analysis types.
To run an analysis:
Install the Intel sampling drivers manually by running these commands:
On Windows* OS:
<vtune-agent-dir>\bin64\amplxe-sepreg.exe
On Linux* OS:
<vtune-agent-dir>/sepdk/src/build-driver
<vtune-agent-dir>/sepdk/src/insmod-sep
The <vtune-agent-dir> is the <vtune_profiler_<version>> installation folder created on the client system by VTune Profiler.
- Configure your analysis target and analysis type.
- Click the
 Start button to run the analysis.
Analyze Process Running Under Arbitrary Account (Linux* OS)
You can use VTune Profiler Server to analyze a process that is running under an arbitrary user account. A common example is analyzing a process in the Attach to Process mode that was previously started under an arbitrary user account. The account running the process is not necessarily the same as the account for which the VTune Profiler Agent was deployed.
To enable this functionality, in the Advanced Options section of the WHAT pane, include the following wrapper script :
#!/bin/sh
#Run VTune collector as the target process owner
sudo -C 65000 -A -u <target process owner> "$@"
The sudo command call runs the VTune Profiler collector under the account specified under <target process owner>. Replace this placeholder with the account name under which the target process is running.
If the target workload or the collector request a sudo elevation during the analysis, VTune Profiler Server requests this password interactively in the Web Interface:

- The interactive sudo elevation requires that the VTune Profiler Agent is deployed under an account that has sudo privileges. To achieve that, ensure that the Username that you provide during deployment belongs to an account with sudo privileges.
- VTune Profiler provides the password directly to the target system and does not store the password.
Control VTune Profiler Agents
The Administrator Dashboard feature of VTune Profiler Server enables you to monitor and manage one or multiple agents from a single point.
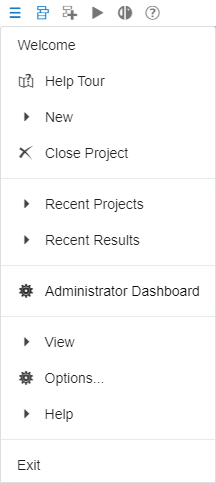
To open the Administrator Dashboard:
Open the VTune Profiler Server interface in your browser.
In the main toolbar, open the drop-down menu and select Administrator Dashboard.
The dashboard opens in a new tab and shows all agents that are related to this instance of VTune Profiler Server. This includes both connected and disconnected agents.

Use the dashboard to:
View information related to this agent:
Target system IP address and hostname
The username of the agent's user.
Current connection status.
Admit or stop one or multiple agents. To admit or stop multiple agents, select the agents by ticking the checkboxes and click Admit selected or Stop selected.