A newer version of this document is available. Customers should click here to go to the newest version.
Understand the Intel® VTune™ Profiler Interface
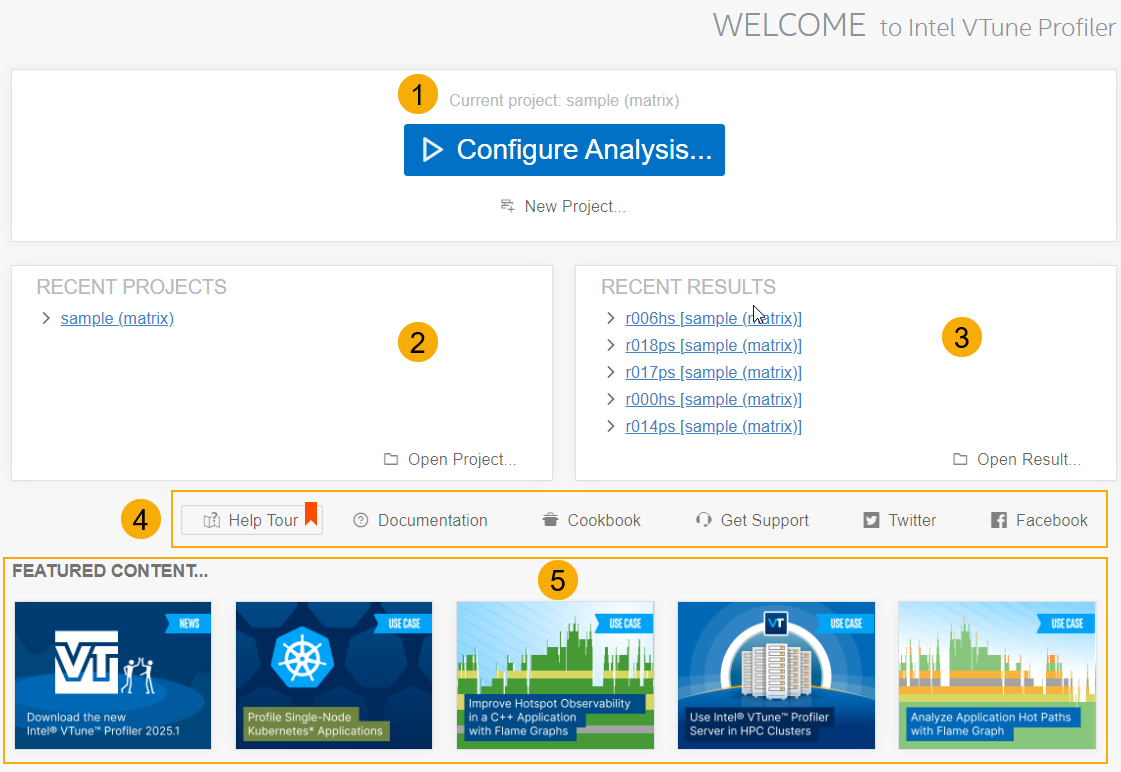
When you start Intel® VTune™ Profiler, a Welcome page opens with links to product news, resources, and directions for your next steps.
| Section | Description |
|---|---|
1 |
You use projects to store the profiling activity you run for an application. A project is a container of profiling results. Create a new projectfor your profiling work. If a project already exists, the most recent project displays as the Current Project. Once a project is ready, set up an analysis with the Configure Analysis button. By default, the Configure Analysis button opens the Performance Snapshot analysis type. This snapshot gives you a quick overview of issues affecting your application performance. For other analysis types, click the analysis header to open the Analysis Tree, which displays all available analyses. |
2 |
See a list of projects that were used recently. |
3 |
The results you save from a profiling analysis appear in this list. The last two letters in the name of each result indicates the analysis type that was used for the data collection. For example, tr stands for Threading analysis. Hover over a result name in the list to see the full path to the result file. |
4 |
Use the link bar to access additional informational resources such as Performance Analysis Cookbook, online product documentation or social media channels. Consider getting started with the product by running the Help Tour that guides you through the interface using a sample project. Get a quick overview of the features in the VTune Profiler UI with the Help Tour. The Cookbook contains technical recipes that address common use cases and solutions to profiling challenges. For other issues, browse through the documentation or get product support. You can also discuss your profiling experience in the Analyzers community forum. |
5 |
The Featured Content section promotes the newest pieces of technical content that can help you with your profiling tasks. |
Follow examples in the Get Started Guide to run analyses on a sample (or your own application) on your host system.