A newer version of this document is available. Customers should click here to go to the newest version.
Intel® VTune™ Profiler Graphical User Interface
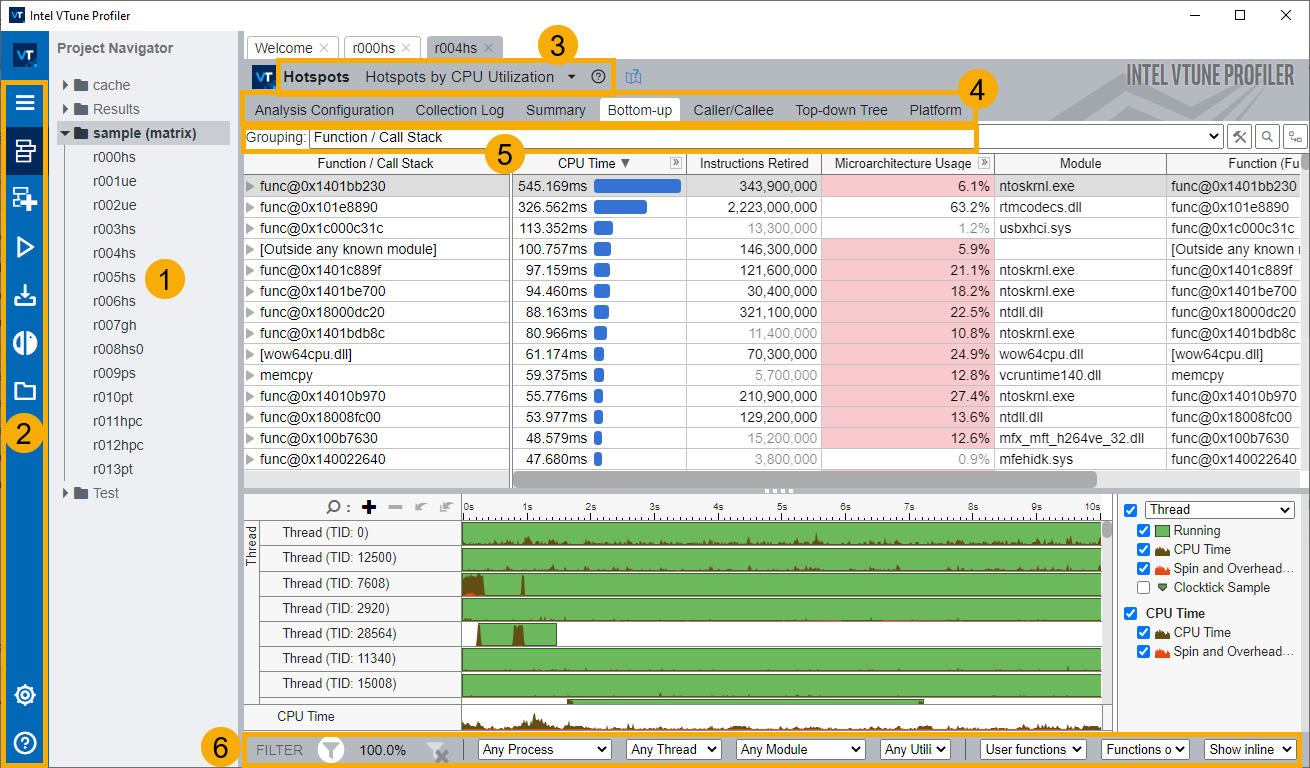
When you run analyses in Intel® VTune™ Profiler, use these features to analyze the data you collect:
| Section | Name | Purpose |
|---|---|---|
1 |
Project Navigator | Manage your projects and the analysis results you collect. |
2 |
Menu and Toolbar | Configure and control the performance analysis with options in these sections. You can also define and view project properties. Click the Use the |
3 |
Analysis type and viewpoint | A viewpoint is a pre-set configuration of windows/panes for an analysis result. For most analysis types, you can click the down arrow to switch between viewpoints and focus on particular performance metrics. |
4 |
Analysis Windows | Switch between window tabs to understand the configuration options and collected data provided by the viewpoints. |
5 |
Grouping | Choose a granularity level for the grouping data in the grid. Available groupings are based on the hierarchy of the program units. Use these groupings to analyze the collected data from different perspectives. For example, if you are developing specific modules in an application and you are interested only in their performance, select the Module/Function/Call Stack grouping and view aggregated data per module functions. |
6 |
Filter Toolbar | You can filter the collected data per object or per time region. Use the options in this section to filter results by object. To filter the data by a time region, first select the region on the timeline. Then, right-click and choose the Filter In by Selection option. |
 button to open/close the Project Navigator.
  Configure Analysis toolbar button to access an analysis configuration.