A newer version of this document is available. Customers should click here to go to the newest version.
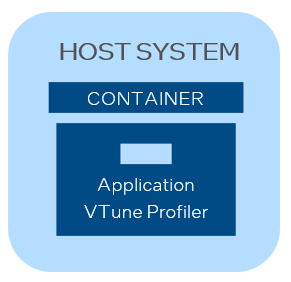
Option 1: Run Intel® VTune™ Profiler and Your Target Application in the Same Container
Install a Docker* image with Intel® VTune™ Profiler. Use this installation to profile native or Java* applications running inside the same container.
Prerequisites
Create and configure a Docker image.
If you installed VTune Profiler using the Intel® oneAPI Base Toolkit, pull an existing Docker image from the Docker Hub repository:
host> image=amr-registry.caas.intel.com/oneapi/oneapi:base-dev-ubuntu20.04
host> docker pull "$image"
Make all host processes visible from the container. Run your Docker image with --pid=host:
host> docker run --pid=host --cap-add=SYS_ADMIN --cap-add=SYS_PTRACE -it "$image"
Here, the SYS_ADMIN value adds a capability to run hardware event-based sampling analysis; the SYS_PTRACE value enables user-mode sampling analysis.
Copy your application to the running Docker container. For example:
host> docker cp /home/samples/matrix.tar 98fec14f0c08:/var/local
where 98fec14f0c08 is your container ID.
Compile your target in the container, if required.
Install and Run VTune Profiler in a Container
You can skip this section if you installed VTune Profiler from the Intel oneAPI Base Toolkit.
Install the command-line interface of VTune Profiler inside your Docker container.
Make sure to select the [2] Custom installation > [3] Change components to install and de-select components that are not required in the container environment: [3] Graphical user interface and [4] Platform Profiler.
After installation, set up environment variables for the VTune Profiler. For example, for VTune Profiler in Intel oneAPI Base Toolkit:
container> source /opt/intel/oneapi/vtune/version/env/vars.sh
Profile Your Target Application in the Container
Select one of these target and analysis types:
Target Type |
Analysis Type |
|---|---|
|
|
To run an analysis, enter:
vtune -collect <analysis_type> [options] -- [container_target]
For example:
container> vtune -collect hotspots -knob sampling-mode=hw -- /home/samples/matrix