A newer version of this document is available. Customers should click here to go to the newest version.
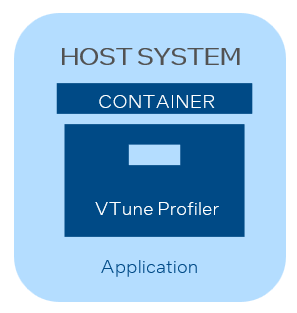
Option 2: Run Intel® VTune™ Profiler in a Container to Profile Your Target Application on the Host
Install a Docker* image with Intel® VTune™ Profiler. Use this installation to profile native or Java* applications running outside the container.

Prerequisites
Create and configure a Docker image.
If you installed VTune Profiler using the Intel® oneAPI Base Toolkit, pull an existing Docker image from the Docker Hub repository:
host> image=amr-registry.caas.intel.com/oneapi/oneapi:base-dev-ubuntu20.04
host> docker pull "$image"
Make all host processes visible from the container. Run your Docker image with --pid=host:
host> docker run --pid=host --cap-add=SYS_ADMIN --cap-add=SYS_PTRACE -it "$image"
Here, the SYS_ADMIN value adds a capability to run hardware event-based sampling analysis; the SYS_PTRACE value enables user-mode sampling analysis.
Copy your application to the running Docker container. For example:
host> docker cp /home/samples/matrix.tar 98fec14f0c08:/var/local
where 98fec14f0c08 is your container ID.
Compile your target in the container, if required.
Install and Run VTune Profiler in a Container
You can skip this section if you installed VTune Profiler from the Intel oneAPI Base Toolkit.
Install the command-line interface of VTune Profiler inside your Docker container.
Make sure to select the [2] Custom installation > [3] Change components to install and de-select components that are not required in the container environment: [3] Graphical user interface and [4] Platform Profiler.
After installation, set up environment variables for the VTune Profiler. For example, for VTune Profiler in Intel oneAPI Base Toolkit:
container> source /opt/intel/oneapi/vtune/version/env/vars.sh
Run Analysis for Your Host Target
Choose from one of these target and analysis types:
Target Type |
Analysis Type |
|---|---|
|
|
To run an analysis, enter:
vtune -collect <analysis_type> [options] -- [host_target]
For example:
container> vtune -collect hotspots -target-process java
Known Issues:
Issue: Function-level analysis is not available by default. VTune Profiler maps the samples to the binaries from user target app but it cannot resolve the functions because the binaries from the host are not available from the container.
Solution: Run the Docker container with the mounted host folder containing the binaries and specify a search directory as an argument to the vtune command.
Issue:VTune Profiler is run in the container by the root user while the app on the host is run by a non-root user. As a result, User-Mode Sampling Hotspots analysis fails to run with an error "Both target and VTune Profiler should be run by the same user".
Solution: Make sure the same user runs VTune Profiler in the container and the target app outside the container.