1.1. Features
1.2. Device Support
1.3. Resource Utilization and Performance
1.4. Installing and Licensing Intel® FPGA IP Cores
1.5. Customizing and Generating IP Cores
1.6. Functional Description
1.7. Using the Fault Injection Debugger and Fault Injection IP Core
1.8. Fault Injection IP Core User Guide Archives
1.9. Document Revision History for Fault Injection IP Core User Guide
1.7.3. Using the Fault Injection Debugger
To use the Fault Injection Debugger, you connect to your device via the JTAG interface. Then, configure the device and perform fault injection.
To launch the Fault Injection Debugger, choose Tools > Fault Injection Debugger in the Intel® Quartus® Prime software.
Note: Configuring or programming the device is similar to the procedure used for the Programmer or Signal Tap Logic Analyzer.
Figure 9. Fault Injection Debugger
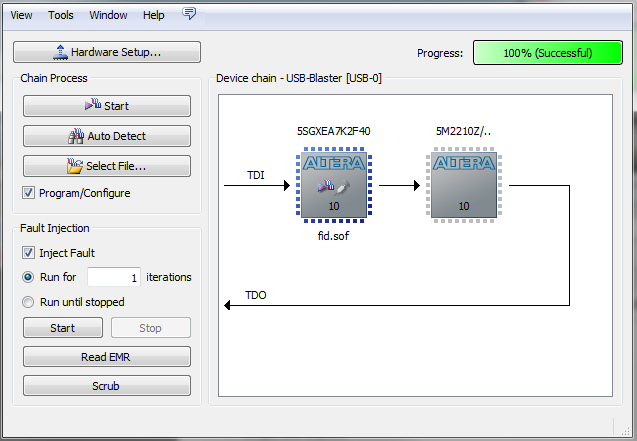
To configure your JTAG chain:
- Click Hardware Setup. The tool displays the programming hardware connected to your computer.
- Select the programming hardware you wish to use.
- Click Close.
- Click Auto Detect, which populates the device chain with the programmable devices found in the JTAG chain.