A newer version of this document is available. Customers should click here to go to the newest version.
Toolbars
The menu items are shown in the toolbar area as shortcuts to frequently used operations. Hover the mouse over an icon on a toolbar to see a tooltip with description.
File toolbar: Provides access to the functionality from the File menu.

Edit toolbar: Provides access to the editing operations from the Edit menu.

Window toolbar: Provides the show/hide toggle capability for configurable GUI elements. From left to right, these icons represent the Toolbox, Reports, and Charts tabs.
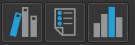
Hide the Toolbox tab, which contains the Designer Mode, Analysis Mode, and Hierarchical View tabs to increase available screen space for large graphs.
Hide the Reports tab, which shows information such as node properties or output of analytics algorithms, to get more screen space for visualizing large graphs.
By default, the Charts tab is hidden if the graph does not have associated execution trace data. When the trace data is available, the Charts tab is displayed.
Analytics toolbar: Provides a subset of plugins from the Analytics menu. A plugin can be hidden in the toolbar, but it is always registered in the Analytics menu.

The analytics supported for Intel® oneAPI Threading Building Blocks (oneTBB) flow graphs are, from left to right in the toolbar, Compute Critical Path, Graph Rule-Check, and Compute Modeling Projection. Use these algorithms to design new and tune existing graphs.
Layout toolbar: Provides a subset of the layouts from the Layout menu.

Zoom toolbar: Allows you to zoom in or out the canvas area that displays the graph. The reset-zoom button resets the zoom factor, so the entire graph is visible in the canvas area.

NOTE:You can also zoom in or out using the mouse-wheel when the mouse is in the canvas area.Trace Data Collector toolbar: Opens a dialog box to configure a data collection run on a oneTBB flow graph application. This dialog box also allows you to configure the environment before launching the application.

What’s This? toolbar: Switches to the What's This? mode.

NOTE:You can also switch to this mode using the Shift+F1 keyboard shortcut.