A newer version of this document is available. Customers should click here to go to the newest version.
Examine Relationships Between Memory Levels
Accuracy Level
Medium
Enabled Analyses
Survey + Characterization (Trip Counts and FLOP, Call Stacks, Memory-Level) + Memory Access Patterns
Result Interpretation
In the Medium accuracy preset, the Intel® Advisor extends the basic Roofline capability and collects metrics for all memory levels and the callstack data, which allows you to analyze your application in more detail. Roofline chart uses the results of Memory Access Patterns analysis to understand what bounds the loop and build recommendations in Roofline Guidance.
For information about Memory Access Patterns data interpretation, refer to Investigate Memory Usage and Traffic.
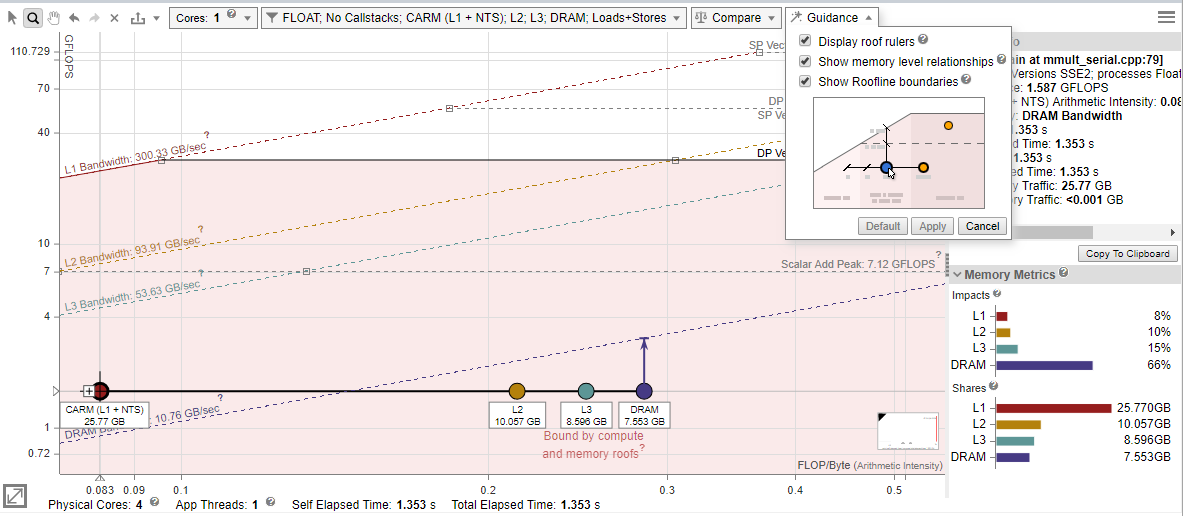
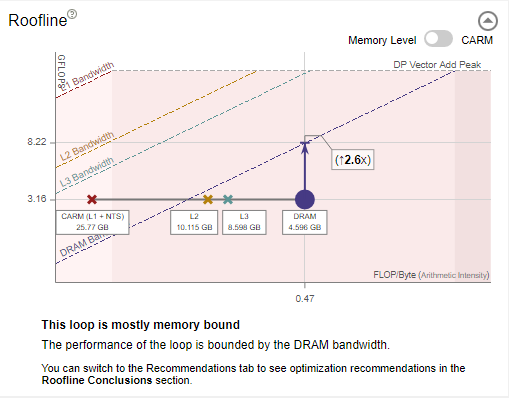
Memory-Level Roofline
The Memory-Level Roofline allows you to examine each loop at different cache levels and arithmetic intensities and provides precise insights into which cache level causes the performance bottlenecks.
The Memory-Level Roofline can help you to:
- Determine which loops are limited by cache
- Find inefficient access patterns
- Locate loops that can benefit from vectorization or threading optimizations
To configure the Memory-Level Roofline chart:
- Expand the filter pane in the Roofline chart toolbar.
- In the Memory Level section, select the memory levels you want to see metrics for.
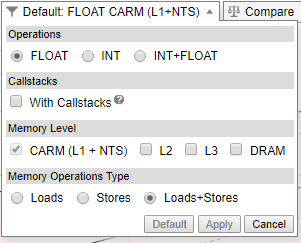
- Click Apply.
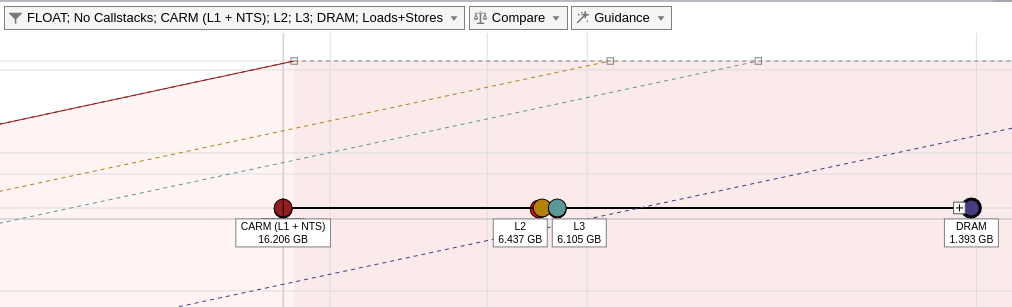
- In the Roofline chart, double-click a loop to examine how the relationships between displayed memory levels and roofs. Labeled dots are displayed, representing memory levels with arithmetic intensity for the selected loop/function; lines connect the dots to indicate that they correspond to the selected loop/function.
- Go to Project Properties > Trip Count and FLOP.
- In the Cache simulator field, click Modify.
- Click Add and enter/select the desired cache configurations.
- Re-run the Roofline with the Medium accuracy.
Memory-Level Roofline Data
Intel® Advisor collects integrated traffic data for all traffic types between a CPU and different memory subsystem using cache simulation. With this data, Intel® Advisor counts the number of data transfers for a given cache level and computes AI for each loop and each memory level.
Review the changes in the traffic from one memory level to another and compare it to respective to identify the memory hierarchy bottleneck for the kernel and determine optimization steps based on this information.
- The vertical distance between memory dots and their respective roofline shows how much you are limited by a given memory subsystem. If a dot is close to its roof line, it means that the kernel is limited by the performance of this memory level.
- The horizontal distance between memory dots indicates how efficiently the loop/function uses cache. For example, if L3 and DRAM dots are very close on the horizontal axis for a single loop, the loop/function uses L3 and DRAM similarly. This mean that it does not use L3 and DRAM efficiently. You can try to improve re-usage of data in the code to change arithmetic intensity for all loops/functions and improve application performance. For more precise advice, see the Roofline Guidance in the Code Analytics tab.
Arithmetic intensity determines the order in which dots are plotted, which can provide some insight into your code's performance. For example, the L1 dot should be the largest and first plotted dot on the chart from left to right. However, memory access type, latency, or technical issues can change the order of the dots. Continue to run the Memory Access Pattern analysis to investigate this issue.
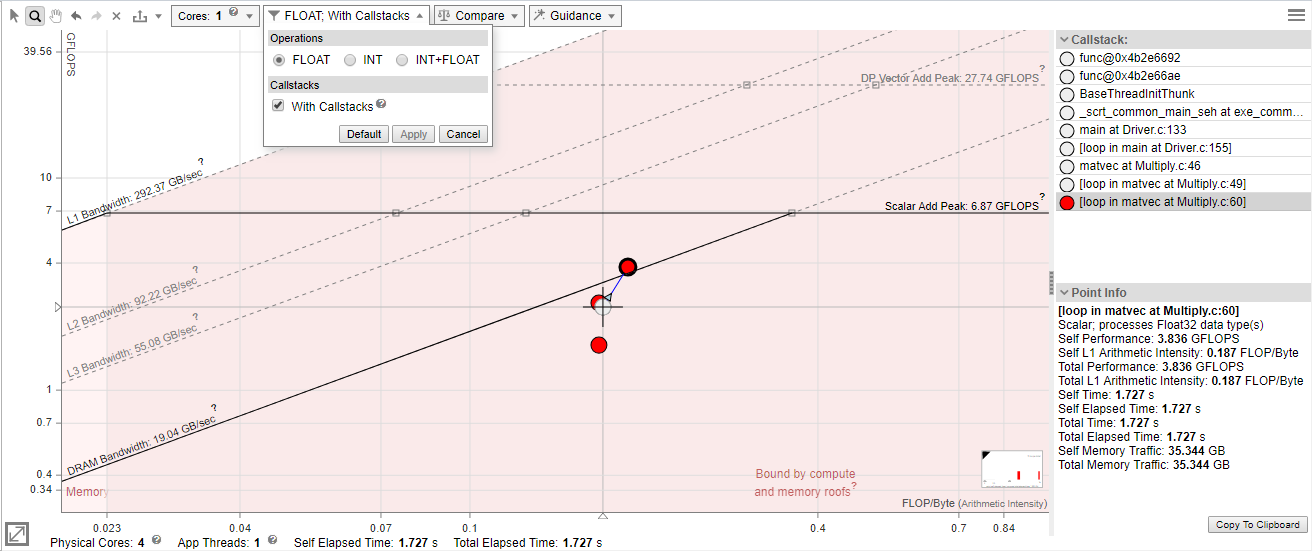
To examine a specific loop in more details, select a dot on the chart and open the Code Analytics tab below the chart:
- Review the amount of data transferred for the selected loop/function and a specific roof that bounds the loop in the Roofline pane. Use this pane to analyze deeper a selected loop/function:
- It shows only roofs with number of threads, data types, and instructions mix used in the loop.
- It identifies what exactly bounds the selected loop - memory, compute, or both memory and compute.
- It determines exact roof that bounds the loop and estimates a potential speedup for the loop in the callout if you optimize it for this roof.
- Review the memory metrics for different memory levels (L1, L2, L3 and DRAM) and the number of operations transferred (FLOP and INTOP) in the Data transfers and Bandwidth table. This indicates the amount of self data (excluding data from inner loops/functions) or total data (including data from inner loops/functions) transferred, memory level bandwidth, and percentage of memory used at each memory level.
NOTE:Total data transfers are available only if you collect Roofline with Callstacks.
- Review the amount of data processed at different memory levels for the selected loop in the Memory Metrics pane. The pane shows two histograms:
- Review the time spent processing requests for each memory level reported in the Impacts histogram. A big value indicates a memory level that bounds the selected loop. Examine the difference between the two largest bars to see how much throughput you can gain if you reduce the impact on your main bottleneck. It also gives you a long-time plan to reduce your memory bound limitations as once you will solve the problems coming from the widest bar, your next issue will come from the second biggest bar and so on. Ideally, a developer would like to see the L1 as the most impactful memory in the application for each loop.
- Review an amount of data that passes through each memory level reported in the Shares histogram.
NOTE:Metrics in the Memory Metrics pane calculated for a dominant operation type in the selected loop (FLOAT or INT) and based on the total data aggregating all callctacks. Hover over the ? icon for the whole pane to see the tooltip that indicates the dominant type.
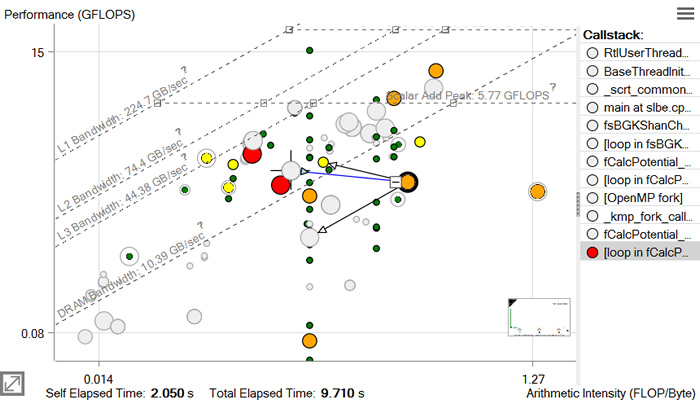
Roofline with Callstacks
Intel® Advisor basic Roofline model, the Cache-Aware Roofline Model (CARM), offers self data capability. Intel® Advisor Roofline with Callstacks feature extends the basic model with total data capability:
Self data = Memory access, FLOPs, and duration related only to the loop/function itself and excludes data originating in other loops/functions called by it
Total data = Data from the loop/function itself and its inner loops/functions
The total-data capability in the Roofline with Callstacks feature can help you:
Investigate the source of loops/functions instead of just the loops/functions themselves.
Get a more accurate view of loops/functions that behave differently when called under different circumstances.
Uncover design inefficiencies higher up the call chain that could be the root cause of poor performance by smaller loops/functions.
To view the callstacks, enable the With Callstacks checkbox in the Roofline chart.
To show/hide dot descendants:
Click a loop/function dot
 control to collapse descendant dots into the parent dot.
 Click a loop/function dot
 control to show descendant dots and their relationship with visual indicators to the parent dot.
Roofline with Callstacks Chart Data
The following Roofline chart representation shows some of the added benefits of the Roofline with Callstacks feature, including:
A navigable, color-coded Callstack pane that shows the entire call chain for the selected loop/function, but excludes its callees
Visual indicators (caller and callee arrows) that show the relationship among loops and functions
The ability to simplify dot-heavy charts by collapsing several small loops into one overall representation
Loops/functions with no self data are grayed out when expanded and in color when collapsed. Loops/functions with self data display at the coordinates, size, and color appropriate to the data when expanded, but have a gray halo of the size associated with their total time. When such loops/functions are collapsed, they change to the size and color appropriate to their total time and, if applicable, move to reflect the total performance and total arithmetic intensity.