A newer version of this document is available. Customers should click here to go to the newest version.
Finding Tasks with Small Durations
Tasks executed by a flow graph are spawned as Intel® oneAPI Threading Building Blocks (oneTBB) tasks, so the task duration must be large enough to amortize the cost of a task spawn.
Finding Tasks with Small Durations using Statistics
Open the Statistics tab in the bottom pane.
Open the Graph tab to see execution time metrics. The metrics are computed as the mean and standard deviation for each node based on the execution traces.
- Sort the resulting data by the Avg Task Duration column to identify the nodes with the smallest average durations.
Any node with an average duration of a few microseconds requires that you additionally inspect it, because any concurrency gained by its parallel execution may be overwhelmed by its scheduling costs.
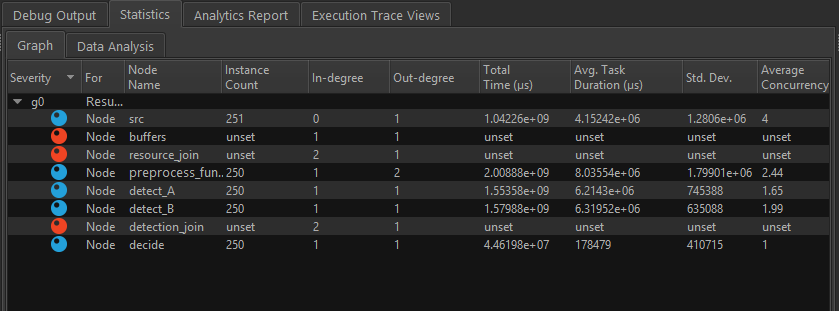
The screenshot above shows a sample graph that executed 250 times. Notice the Count column, which is the number of times a node executes, is 250 for all functional nodes. Inspect the Avg Task Duration column for nodes that execute in a few microseconds.
Finding Tasks with Small Durations using Treemap
Another way to visualize task durations and the average concurrencies of each node is the Treemap view in the Analysis Mode tab. If multiple graphs are present in the application run, you see a high-level treemap showing the health of all the graphs in the run.
The Treemap view organizes the nodes in the graph by node durations. The larger the area of the square, the more time the node spent on the CPU. The node color is determined by the average observed concurrency of the graph while the node was running, and the colors use the same scale as in the active thread chart. A red node indicates poor concurrency when the node is executed on the system.
Hover a mouse over the Treemap to see the details about nodes in the graph. Double-click the graph in the Treemap view to keep the node treemap visible.
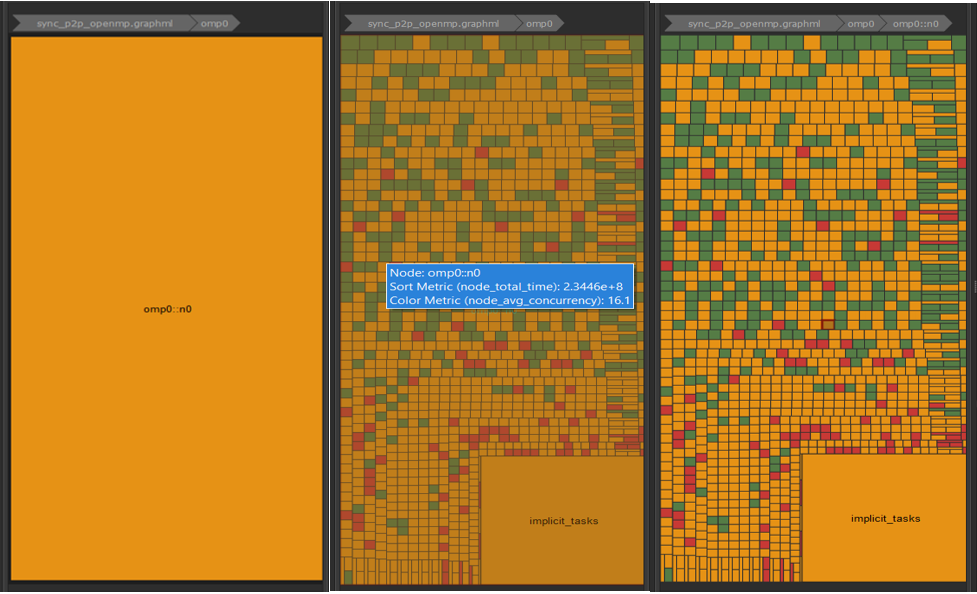
When a graph has nested subgraphs, the treemap presents this information by embedding the nested subgraph in the node which spawned the subgraph. This is visually represented by increasing the width of the border surrounding each node that contain subgraphs.
Hover the mouse over a node that has embedded subgraphs to see the hidden subgraph.
Double-click the node to zoom to the child-node level and see the contents of the embedded subgraph as a treemap.
Click any node in the Treemap view to highlight that node in the graph view on the canvas. If you select the default zoom factor or reset the zoom factor, clicking a node in the Treemap view zooms in and centers on the node in the graph view. The smaller the node size, the smaller the tasks executed by that node.
The Treemap view supports three different layouts for visualizing the treemap: squarified layout, alternating layout, and snake layout. All three layouts use:
- The node CPU time to determine the size of each node in the treemap
- The average concurrency observed in the graph while a node was active to determine the color
To switch between layouts:
Open the Preferences window.
Go to the GUI > General.
Change the value of the Default Treemap Rendering option in the Analysis View group.