A newer version of this document is available. Customers should click here to go to the newest version.
Charts
This area displays the task execution trace data available for a graph. You can zoom in or zoom out of all charts in this area to inspect them at various resolutions. Use the mouse wheel or the buttons in the Zoom toolbar above the charts to zoom in or zoom out.

The execution traces are displayed in two different forms:
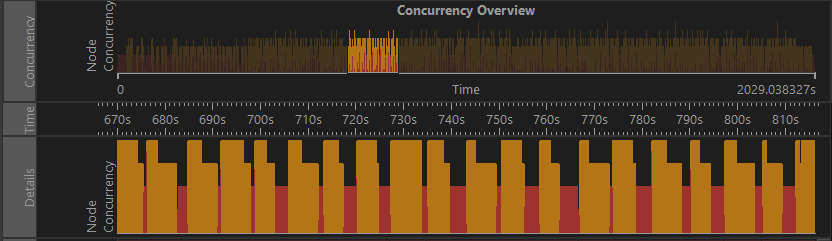
Node Concurrency display: This form includes two charts.
The top chart shows the concurrency for the entire length of the application run.
The bottom chart shows the details of the zoomed region in the top chart.
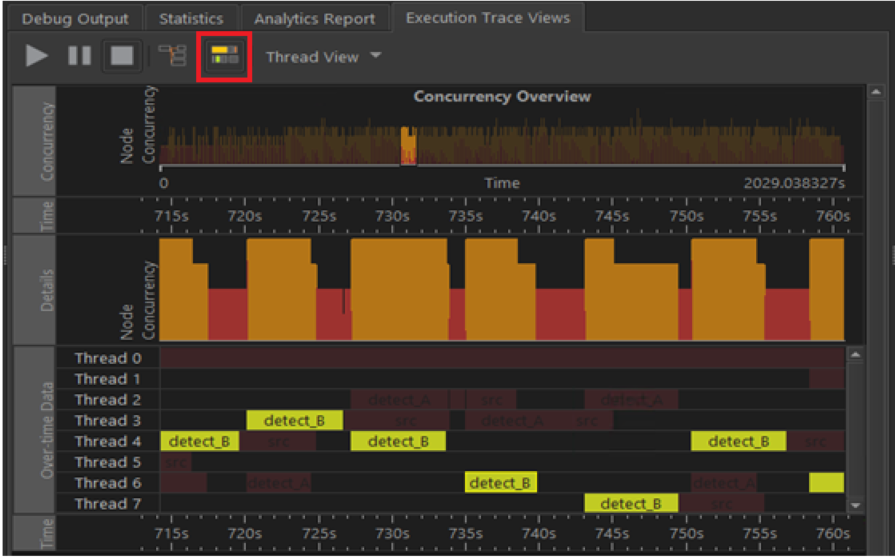
Per-Thread Task display: This chart shows tasks executed by each thread and their duration. To see tasks associated with a particular node, enable the Show/Hide Selected tasks button.
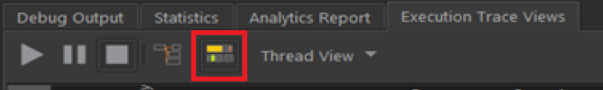
You can zoom in or out the data in both views using the specific buttons in the chart toolbar or a mouse wheel. Use the drop-down box in the toolbar to switch between a Thread View and a Node View.
In the Thread View, the vertical axis is a set of threads that participated in executing the flow graph, and the horizontal axis is time. Tasks with short durations are displayed with a lighter color than those with a longer duration. The lighter color highlights tasks that are small relative to the cost of scheduling the task.
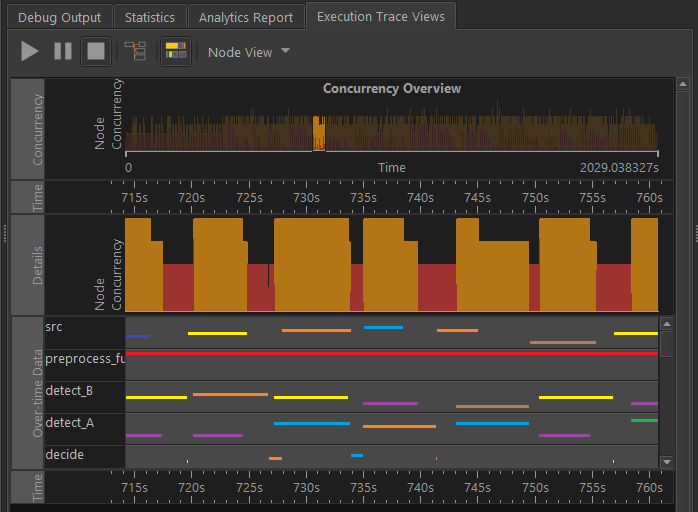
In the Node View, a set of thread timelines is created for each node in the graph. In each set, the vertical axis is a set of threads that participated in executing the flow graph, and the horizontal axis is time.
NOTE:In the Node View, a node’s set of timelines only displays tasks related to that node, while in the Thread View, a single set of timelines shows the tasks related to all nodes.
In some cases, the trace data can contain additional information about the logical core on which a task executes and the data ID it is processing with the help of user-APIs supported by oneTBB and the Flow Graph Analyzer. When this information is available, you can visualize the Thread View data and color it by core information or by the data being processed.