A newer version of this document is available. Customers should click here to go to the newest version.
OpenMP* Constructs in the Graph Canvas
To map OpenMP* parallel regions and task constructs to a graph, run the fgt2xml converter with the --omp_experimental flag. In such graph, nodes represent parallel regions and tasks, and edges represent task dependencies
Parallel Regions
All OpenMP-related parallelism is contained within OpenMP parallel regions. In the Flow Graph Analyzer, a parallel region is mapped to a subgraph node in the graph canvas. Inside the subgraph node are at least two nodes:
- A node that represents the start of the parallel region.
- A node that represents the implicit barrier at the end of the region.
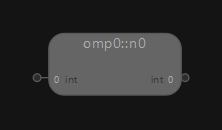
For example, for an empty parallel region like the following, the Flow Graph Analyzer creates a subgraph node, such as omp0::n0, in the graph canvas.
#pragma omp parallel
{
}
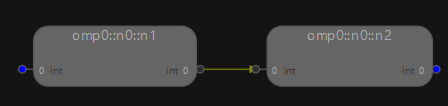
When you double-click the subgraph node, you see the following, where omp0::n0::n1 is the start of the parallel region and omp0::n0::n2 is the implicit barrier at the end of the node.
OpenMP* Tasks
An OpenMP* task is a block of code contained in a parallel region that can be executed simultaneously with other tasks in the same region. In the Flow Graph Analyzer, an OpenMP task is mapped to a generic node. For example, in the code below, there are two tasks: one prints hello and the other prints world. The order in which these tasks execute is not specified, so they can execute in any order. However, the two tasks always start after the enclosing parallel region begins, and they complete before the enclosing parallel region ends.
#pragma omp parallel
{
  #pragma omp task
    {  printf("hello "); }
  #pragma omp task
    {  printf("world "); }
}
When you visualize this program in the Flow Graph Analyzer, it looks like this:
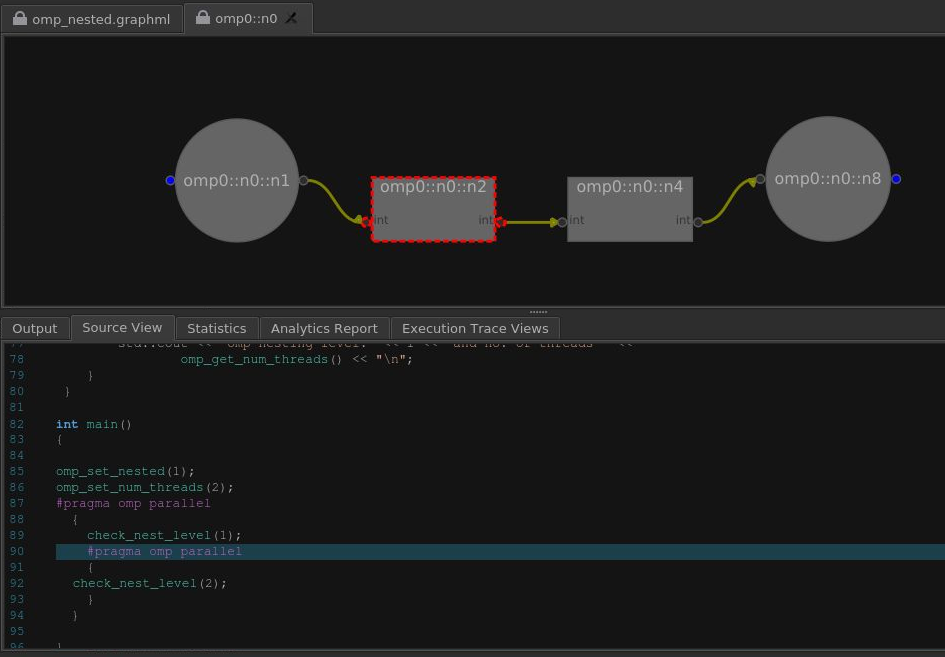
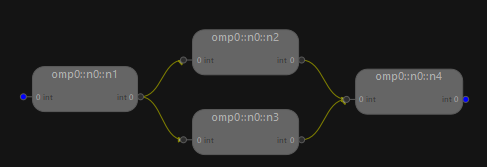
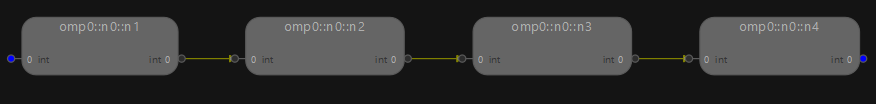
When you double-click this subgraph, you see the following, where omp0::n0::n1 is the start of the parallel region, omp0::n0::n4 is the implicit barrier at the end of the region, omp0::n0::n2 is the "hello" task and omp0::n0::n3 is the "world" task.
OpenMP* Task Dependencies
In the OpenMP* specification, a partial ordering of tasks can be expressed with depend clauses. The task dependence is fulfilled when the predecessor task completes. There are three dependency types supported by the OpenMP API: in, out, and in-out:
- in dependency type: The generated task is a dependent task of all previously generated sibling tasks that reference at least one of the list items in an out or in-out clause.
- out and in-out dependency types: The generated task is a dependent task of all previously generated sibling tasks that reference at least one of the list items in an in, out, or in-out clause.
In the Flow Graph Analyzer, task dependencies are represented by edges between the nodes that represent OpenMP tasks.
It is important to understand what dependencies are visualized in the Flow Graph Analyzer.
The task dependency graph represents the partial order set by the depend clauses for the OpenMP tasks executed by the application. The nodes in the graphs are OpenMP tasks and the edges represent the partial order.
To reduce the complexity of the graph, the Flow Graph Analyzer omits some transitive dependencies. A transitive dependence is a dependency between three tasks, such that if it holds between the first and the second tasks and between the second and the third tasks, it must hold between the first and the third tasks. In the figure below, the node a must execute before the node b in the partial order due to a dependency on the location x as a <x b.
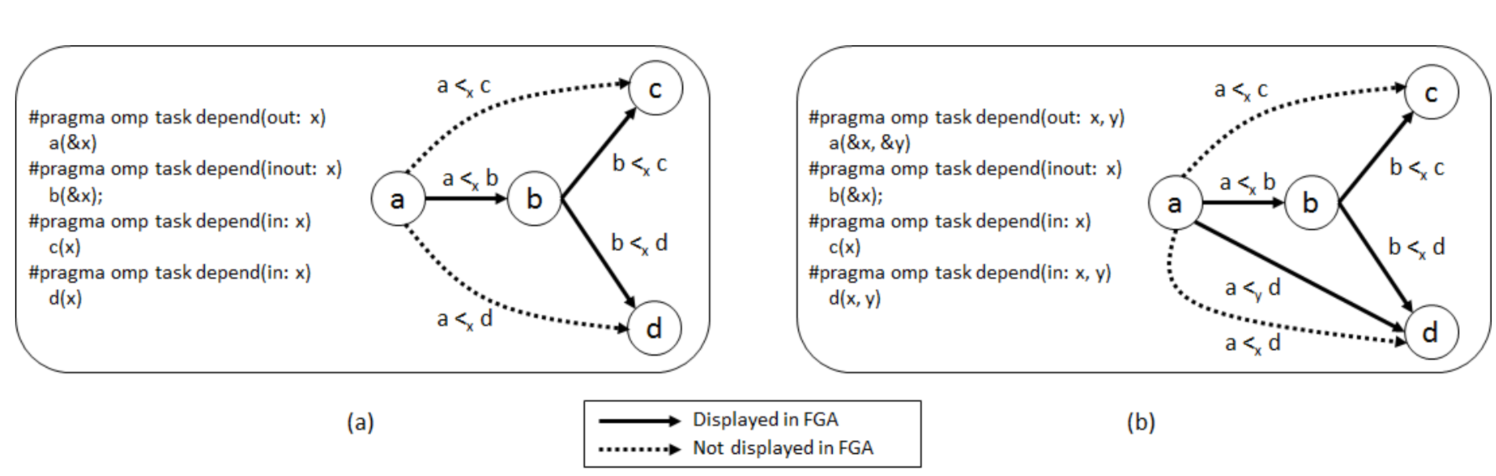
Part (a) of the figure shows an example that only includes dependencies due to a single location x. Because a <x b and b <x d, the Flow Graph Analyzer does not show the transitive edge a <x d.
Part (b) of the figure shows two locations x and y that determine the partial order. There are two potential dependency edges from a to d: a <x d and a <y d. The Flow Graph Analyzer includes an edge from a to d because a is the direct source of y for d, but it excludes a <x d.
For example:
#pragma omp parallel
  {
    std::string s = "";
    #prgma omp single
    {
      #pragma omp task depend( out: s)
        {      s = "hello";
               printf("%s", s);
        }
      #pragma omp task depend( out: s )
        {      s = "world";
               printf("%s",s);
        }
    }
}
This application, when visualized with the Flow Graph Analyzer, has a single top-level subgraph node representing the OpenMP parallel region.
When you double-click this subgraph, you see the following:
The edge between omp0::n0::n2 and omp0::n0::n3 represents task dependency due to the variable s.
The main components of the Flow Graph Analyzer include the treemap view, the graph-topology canvas, the timeline and concurrency histogram view, and the critical-path report. OpenMP task traces map naturally to these views:
- The treemap view shows the time spent in each OpenMP parallel region, colored according to the average application concurrency during the time it was executing.
- The graph topology canvas shows the partial ordering of the tasks.
- The timeline and concurrency histogram view show the execution of each task on the OpenMP runtime threads and the application concurrency over time.
- The critical report shows the most time-consuming path from each source to each sink in the graph, sorted with the longest critical path at the top.
For more examples, see https://link.springer.com/chapter/10.1007/978-3-319-98521-3_12.
OpenMP* Nodes to Source Code Mapping:
In addition to the graphical view of OpenMP* task dependency graphs, the Flow Graph Analyzer also shows nodes mapping to corresponding source code. To get this information, you must build an OpenMP application with the -g flag.
For example, source code mapping with subgraph nodes in a parallel region looks as follows: