Visible to Intel only — GUID: GUID-EFDF1A55-6F57-44E4-900C-B7D43199DB2C
Introduction
Install and Launch Intel® Advisor
Set Up Project
Analyze Vectorization Perspective
Analyze CPU Roofline
Model Threading Designs
Model Offloading to a GPU
Analyze GPU Roofline
Design and Analyze Flow Graphs
Minimize Analysis Overhead
Analyze MPI Applications
Manage Results
Command Line Interface
Troubleshooting
Reference
Appendix
Notices and Disclaimers
Annotation Report, Clear Description of Storage Row
Annotation Report, Disable Observations in Region Row
Annotation Report, Pause Collection Row
Annotation Report, Inductive Expression Row
Annotation Report, Lock Row
Annotation Report, Observe Uses Row
Annotation Report, Reduction Row
Annotation Report, Re-enable Observations at End of Region Row
Annotation Report, Resume Collection Row
Annotation Report, Site Row
Annotation Report, Task Row
Annotation Report, User Memory Allocator Use Row
Annotation Report, User Memory Deallocator Use Row
Intel® oneAPI Threading Building Blocks (oneTBB) Mutexes
Intel® oneAPI Threading Building Blocks (oneTBB) Simple Mutex - Example
Test the Intel® oneAPI Threading Building Blocks (oneTBB) Synchronization Code
Parallelize Functions - Intel® oneAPI Threading Building Blocks (oneTBB) Tasks
Parallelize Data - Intel® oneAPI Threading Building Blocks (oneTBB) Counted Loops
Parallelize Data - Intel® oneAPI Threading Building Blocks (oneTBB) Loops with Complex Iteration Control
Add OpenMP Code to Synchronize the Shared Resources
OpenMP Critical Sections
Basic OpenMP Atomic Operations
Advanced OpenMP Atomic Operations
OpenMP Reduction Operations
OpenMP Locks
Test the OpenMP Synchronization Code
Parallelize Functions - OpenMP Tasks
Parallelize Data - OpenMP Counted Loops
Parallelize Data - OpenMP Loops with Complex Iteration Control
Where to Find the Flow Graph Analyzer
Launching the Flow Graph Analyzer
Flow Graph Analyzer GUI Overview
Flow Graph Analyzer Workflows
Designer Workflow
Generating C++ Stubs
Preferences
Scalability Analysis
Collecting Traces from Applications
Nested Parallelism in Flow Graph Analyzer
Analyzer Workflow
Experimental Support for OpenMP* Applications
Sample Trace Files
Additional Resources
accuracy
append
app-working-dir
assume-dependencies
assume-hide-taxes
assume-ndim-dependency
assume-single-data-transfer
auto-finalize
batching
benchmarks-sync
bottom-up
cache-binaries
cache-binaries-mode
cache-config
cache-simulation
cache-sources
cachesim
cachesim-associativity
cachesim-cacheline-size
cachesim-mode
cachesim-sampling-factor
cachesim-sets
check-profitability
clear
config
count-logical-instructions
count-memory-instructions
count-memory-objects-accesses
count-mov-instructions
count-send-latency
cpu-scale-factor
csv-delimiter
custom-config
data-limit
data-reuse-analysis
data-transfer
data-transfer-histogram
data-transfer-page-size
data-type
delete-tripcounts
disable-fp64-math-optimization
display-callstack
dry-run
duration
dynamic
enable-cache-simulation
enable-data-transfer-analysis
enable-task-chunking
enforce-baseline-decomposition
enforce-fallback
enforce-offloads
estimate-max-speedup
evaluate-min-speedup
exclude-files
executable-of-interest
exp-dir
filter
filter-by-scope
filter-reductions
flop
force-32bit-arithmetics
force-64bit-arithmetics
format
gpu
gpu-carm
gpu-sampling-interval
hide-data-transfer-tax
ignore
ignore-app-mismatch
ignore-checksums
instance-of-interest
integrated
interval
limit
loop-call-count-limit
loop-filter-threshold
loops
mark-up
mark-up-list
memory-level
memory-operation-type
mix
mkl-user-mode
model-baseline-gpu
model-children
model-extended-math
model-system-calls
module-filter
module-filter-mode
mpi-rank
mrte-mode
ndim-depth-limit
option-file
overlap-taxes
pack
profile-gpu
profile-intel-perf-libs
profile-jit
profile-python
profile-stripped-binaries
project-dir
quiet
recalculate-time
record-mem-allocations
record-stack-frame
reduce-lock-contention
reduce-lock-overhead
reduce-site-overhead
reduce-task-overhead
refinalize-survey
remove
report-output
report-template
result-dir
resume-after
return-app-exitcode
search-dir
search-n-dim
select
set-dependency
set-parallel
set-parameter
show-all-columns
show-all-rows
show-functions
show-loops
show-not-executed
show-report
small-node-filter
sort-asc
sort-desc
spill-analysis
stack-access-granularity
stack-stitching
stack-unwind-limit
stacks
stackwalk-mode
start-paused
static-instruction-mix
strategy
support-multi-isa-binaries
target-device
target-gpu
target-pid
target-process
target-system
threading-model
threads
top-down
trace-mode
trace-mpi
track-memory-objects
track-stack-accesses
track-stack-variables
trip-counts
verbose
with-stack
Error Message: Application Sets Its Own Handler for Signal
Error Message: Cannot Collect GPU Hardware Metrics for the Selected GPU Adapter
Error Message: Memory Model Cache Hierarchy Incompatible
Error Message: No Annotations Found
Error Message: No Data Is Collected
Error Message: Stack Size Is Too Small
Error Message: Undefined Linker References to dlopen or dlsym
Problem: Broken Call Tree
Problem: Code Region is not Marked Up
Problem: Debug Information Not Available
Problem: No Data
Problem: Source Not Available
Problem: Stack in the Top-Down Tree Window Is Incorrect
Problem: Survey Tool does not Display Survey Report
Problem: Unexpected C/C++ Compilation Errors After Adding Annotations
Problem: Unexpected Unmatched Annotations in the Dependencies Report
Warning: Analysis of Debug Build
Warning: Analysis of Release Build
Dangling Lock
Data Communication
Data Communication, Child Task
Inconsistent Lock Use
Lock Hierarchy Violation
Memory Reuse
Memory Reuse, Child Task
Memory Watch
Missing End Site
Missing End Task
Missing Start Site
Missing Start Task
No Tasks in Parallel Site
One Task Instance in Parallel Site
Orphaned Task
Parallel Site Information
Thread Information
Unhandled Application Exception
Dialog Box: Corresponding Command Line
Dialog Box: Create a Project
Dialog Box: Create a Result Snapshot
Dialog Box: Options - Assembly
Editor Tab
Dialog Box: Options - General
Dialog Box: Options - Result Location
Dialog Box: Project Properties - Analysis Target
Dialog Box: Project Properties - Binary/Symbol Search
Dialog Box: Project Properties - Source Search
Pane: Advanced View
Pane: Analysis Workflow
Pane: Roofline Chart
Pane: GPU Roofline Chart
Project Navigator Pane
Toolbar: Intel Advisor
Annotation Report
Window: Dependencies Source
Window: GPU Roofline Regions
Window: GPU Roofline Insights Summary
Window: Memory Access Patterns Source
Window: Offload Modeling Summary
Window: Offload Modeling Report - Accelerated Regions
Window: Perspective Selector
Window: Refinement Reports
Window: Suitability Report
Window: Suitability Source
Window: Survey Report
Window: Survey Source
Window: Threading Summary
Window: Vectorization Summary
Visible to Intel only — GUID: GUID-EFDF1A55-6F57-44E4-900C-B7D43199DB2C
Examine Bottlenecks on CPU Roofline Chart
Accuracy Level
Low
Enabled Analyses
Survey + FLOP (Characterization)
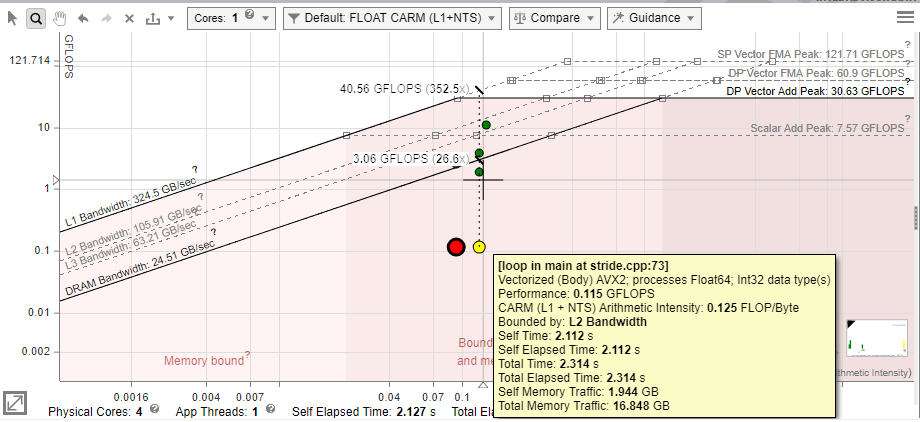
Result Interpretation
The farther a dot is from the topmost roofs, the more room for improvement there is. In accordance with Amdahl's Law, optimizing the loops that take the largest portion of the program's total run time will lead to greater speedups than optimizing the loops that take a smaller portion of the run time.
NOTE:
This topic describes data as it is shown in the CPU Roofline report in the Intel Advisor GUI. You can also view the result in an HTML report, but data arrangement and panes may vary.
- By dot size and color, identify loops that take most of total program time and/or located very low in the chart. For example:
- Small, green dots take up relatively little time, so are likely not worth optimizing.
- Large, red dots take up the most time, so the best candidates for optimization are the large, red dots with a large amount of space between them and the topmost roofs.
NOTE:You can switch between coloring the dots by execution time and coloring the dots by type (scalar or vectorized) in the roof view menu on the right. - Depending on the dots position, identify what the loops are bounded by. Intel® Advisor marks the roofline zones on the chart to help you identify what roofs bound the loop:
- Loop is bounded by memory roofs.
- Loop is bounded by compute roofs.
- Loop is bounded by both memory and compute roofs.
- In the Recommendations tab, scroll down to the Roofline Guidance section that provides you hints on next optimization steps for a selected loop/function.
The roofs above a dot represent the restrictions preventing it from achieving a higher performance, although the roofs below can contribute somewhat. Each roof represents the maximum performance achievable without taking advantage of a particular optimization, which is associated with the next roof up. Depending on a dot position, you can try the following optimizations.
NOTE:
For more precise optimization recommendations, see the Roofline Guidance in Code Analytics and Roofline Conclusions in Recommendations tabs.
Dot Position |
Reason |
To Optimize |
|---|---|---|
Below a memory roof (DRAM Bandwidth, L1 Bandwidth, so on) |
The loop/function uses memory inefficiently. |
Run a Memory Access Patterns analysis for this loop.
|
Below Vector Add Peak |
The loop/function under-utilizes available instruction sets. |
Check Traits column in the Survey report to see if FMAs are used.
|
Just above Scalar Add Peak |
The loop/function is undervectorized. |
Check vectorization efficiency and performance issues in the Survey. Follow the recommendations to improve it if it's low. |
Below Scalar Add Peak |
The loop/function is scalar. |
Check the Survey report to see if the loop vectorized. If not, try to get it to vectorize if possible. This may involve running Dependencies to see if it's safe to force it. |
In the following Roofline chart representation, loops A and G (large red dots), and to a lesser extent B (yellow dot far below the roofs), are the best candidates for optimization. Loops C, D, and E (small green dots) and H (yellow dot) are poor candidates because they do not have much room to improve or are too small to have significant impact on performance.
Some algorithms are incapable of breaking certain roofs. For instance, if Loop A in the example above cannot be vectorized due to dependencies, it cannot break the Scalar Add Peak.
TIP:
If you cannot break a memory roof, try to rework your algorithm for higher arithmetic intensity. This will move you to the right and give you more room to increase performance before hitting the memory bandwidth roof. This would be the appropriate approach to optimizing loop F in the example, as well as loop G if its cache usage cannot be improved.
Analyze Specific Loops
Select a dot on the chart, open the Code Analytics tab to view detailed information about the selected loop:
- Refer to Loop Information pane to examine total time, self time, instruction sets used, and instruction mix for the selected loop. Intel Advisor provides:
- Static instruction mix data that is based on static assembly code analysis within a call stack. Use static instruction mix to examine instruction sets in the inner-most functions/loops.
- Dynamic instruction mix that is based on dynamic assembly code analysis. This metric represents the total count of instructions executed by your function/loop. Use dynamic instruction mix to examine instruction sets in the outer loops and in complex loop-nests.
Intel Advisor automatically determines the data type used in operations. View the classes of instructions grouped by categories in instruction mix:
Category
Instruction Types
Compute (FLOP and INTOP) ADD, MUL, SUB, DIV, SAD, MIN, AVG, MAX, ABS, SIN, SQRT, FMA, RCCP, SCALE, FCOM, V4FMA, V4VNNI Memory - scalar and vector MOV instructions
- GATHER/SCATTER instructions
- VBMI2 compress/expand instructions
Mixed Compute instructions with memory operands Other MOVE, CONTROL FLOW, SYNC, OTHER NOTE:Intel Advisor counts FMA and VNNI instructions as more than 1 operation depending on the size of the data type and/or the type of vector registers used. - Refer to Roofline pane for more details about a specific roof that bounds the loop:
- View roofs with number of threads, data types, and instructions mix used in the loop
- Identify what exactly bounds the selected loop - memory, compute, or both memory and compute
- Determine the exact roof that bounds the loop and estimates a potential speedup for the loop in the callout if you optimize it for this roof
- Refer to Statistics for operations pane to view the count of operations collected during Characterization analysis. Depending on the operations you need, use a drop-down list to choose FLOP, INTOP, FLOP+INTOP or All Operations. Switch between Self and Total data using the toggle in the top right-hand corner of the pane.
Intel Advisor calculates floating-point operations (FLOP) as a sum of the following classes of instructions multiplied by their iteration count: FMA, ADD, SUB, DIV, DP, MUL, ATAN, FPREM, TAN, SIN, COS, SQRT, SUB, RCP, RSQRT, EXP, VSCALE, MAX, MIN, ABS, IMUL, IDIV, FIDIVR, CMP, VREDUCE, VRND
Integer operations (INTOP) are calculated in two modes:
- Potential INT operations (default) that include loop counter operations that are not strictly calculations (for example, INC/DEC, shift, rotate operations). In this case, INTOP is a sum of the following instructions multiplied by their iteration count: ADD, ADC, SUB, MUL, IMUL, DIV, IDIV, INC/DEC, shifts, rotates
- Strict INT operations (available in Python* API only) that include only calculation operations. In this case, INTOP is a sum of the following instructions multiplied by their iteration count: ADD, MUL, IDIV, SUB
Parent topic: Explore CPU/Memory Roofline Results