Intel® Trace Analyzer and Collector User and Reference Guide
Trace Map
Trace Map enables you to zoom into the relevant subsets of large trace file Charts. It represents a miniature view of the MPI function activity over time. By default, the MPI function activity is shown in red color.

The highlighted part of the Trace Map represents the part of the trace file currently displayed on the opened Chart. This highlighted area - the view area - is updated automatically when you start viewing another time interval of the opened Chart. When the time interval of one of the Charts changes, the Trace Map and all opened Charts are updated automatically.
Trace Map is currently unavailable in the Comparison mode.
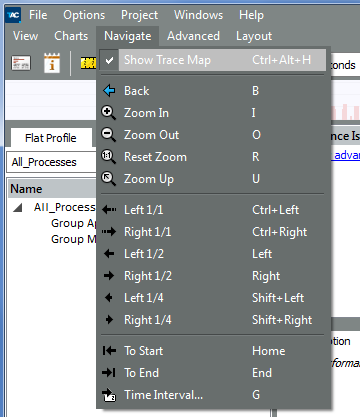
The Trace Map has a context menu to Print, Save or Hide the Chart. To hide the Trace Map through the View Menu, go to View Menu > Navigation > Show Trace Map.
Navigate a chart with the Trace Map:
| Do This: | To Do This: |
|---|---|
| Select a specific area of the Trace Map | Change the time interval and zoom into a specific area of the trace |
| Press and hold the left mouse button on the selected area of the Trace Map and move the mouse to the right or left | Move the highlighted view area to the right or to the left of the Trace Map and see the desired part of the opened Chart |
| Use the keyboard shortcut keys listed below | Move, expand or shrink the view area |
Shortcut Keys:
