Intel® Trace Analyzer and Collector User and Reference Guide
ID
767272
Date
10/31/2024
Public
Tracing Conventional MPI Applications
Tracing Failing MPI Applications
Tracing OpenSHMEM* Applications
Tracing MPI File IO
Handling of Communicator Names
Tracing MPI Load Imbalance
Tracing User Defined Events
Configuring the Collector
Filtering Trace Data
Recording OpenMP* Regions Information
Tracing System Calls (Linux* OS)
Collecting Lightweight Statistics
Recording Source Location Information
Recording Hardware Performance Information (Linux* OS)
Recording Operating System Counters
Tracing Library Calls
Correctness Checking
Tracing Distributed Non-MPI Applications
ACTIVITY
ALTSTACK
AUTOFLUSH
CHECK
CHECK-LEAK-REPORT-SIZE
CHECK-MAX-DATATYPES
CHECK-MAX-ERRORS
CHECK-MAX-PENDING
CHECK-MAX-REPORTS
CHECK-MAX-REQUESTS
CHECK-SUPPRESSION-LIMIT
CHECK-TIMEOUT
CHECK-TRACING
CLUSTER
COMPRESS-RAW-DATA
COUNTER
CURRENT-DIR
DEADLOCK-TIMEOUT
DEADLOCK-WARNING
DEMANGLE
DETAILED-STATES
ENTER-USERCODE
ENVIRONMENT
EXTENDED-VTF
FLUSH-PID
FLUSH-PREFIX
GROUP
HANDLE-SIGNALS
INTERNAL-MPI
KEEP-RAW-EVENTS
LOGFILE-FORMAT
LOGFILE-NAME
LOGFILE-PREFIX
LOGFILE-RANK
MEM-BLOCKSIZE
MEM-FLUSHBLOCKS
MEM-INFO
MEM-MAXBLOCKS
MEM-MINBLOCKS
MEM-OVERWRITE
NMCMD
OS-COUNTER-DELAY
PCTRACE
PCTRACE-CACHE
PCTRACE-FAST
PLUGIN
PROCESS
PROGNAME
PROTOFILE-NAME
STATISTICS
STATE
STF-PROCS-PER-FILE
STF-USE-HW-STRUCTURE
STOPFILE-NAME
SYMBOL
SYNC-MAX-DURATION
SYNC-MAX-MESSAGES
SYNC-PERIOD
SYNCED-CLUSTER
SYNCED-HOST
TIME-WINDOWS (Experimental)
TIMER
TIMER-SKIP
UNIFY-COUNTERS
UNIFY-GROUPS
UNIFY-SCLS
UNIFY-SYMBOLS
VERBOSE
VT_START_PAUSED
VT_COMPRESS_TRACE
Parameter Checking
Premature Exit
Overlapping Memory
Detecting Illegal Buffer Modifications
Buffer Given to MPI Cannot Be Read or Written
Distributed Memory Checking
Illegal Memory Access
Request Handling
Datatype Handling
Buffered Sends
Deadlocks
Checking Message Transmission
Datatype Mismatches
Data Modified during Transmission
Checking Collective Operations
Freeing Communicators
Process Aggregation
Function Aggregation
Function Group Color Editor
Filtering Dialog Box
Tagging Dialog Box
Idealization Dialog Box
Imbalance Diagram Dialog Box
Trace Merge Dialog Box
Details Dialog Box
Source View Dialog
Time Interval Selection
Configuration Dialogs
Find Dialog Box
Command line for Intel® VTune™ Profiler and Intel® Advisor Dialog Box
OTF2 to STF Conversion Dialog Box
Configuration Assistant
Detailed Dialog
If you right-click the point where the correctness checking reposrts (CCRs) are present, you can get information about them in the detailed dialog box. The information contains all fields of the Report Data structure that comes from STF. Each data item may contain five fields that are specifiers for the particular report. You can expand each report item in the Detailed Dialog to get the information from the specifiers.
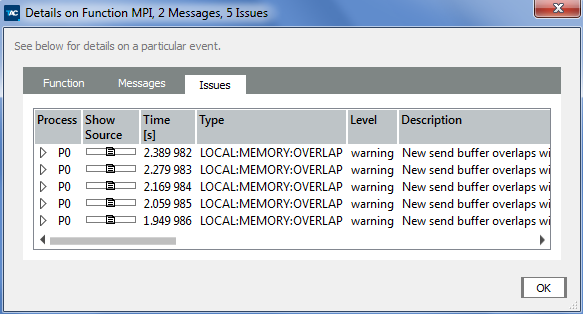
There can be the following fields:
| Field: | Description: |
|---|---|
| Process | Expand the drop-down menu to see processes in which the issue occurred |
| Show Source | Press this button to get the exact line in the code at which the issue occurred |
| Time | See the moment of time (in seconds or ticks) at which the issue occurred |
| Type | See the type of the issue in this string |
| Level | See the level of the issue in this string. It can be warning or error. |
| Entry Time | See the vector containing moments of time for every process involved into the issue |
| Entry Process | See the vector containing numbers of the processes involved into the issue |
| Header | See the vector of strings containing descriptions of the issue for a particular process |
| Call | See the vector of strings containing function calls involved into the issue |
| Function | See the vector of functions involved into the issue |
The values of fields from Entry Time to Function can be different; the sizes of these vectors are equal to each other.
Parent topic: Viewing Correctness Checking Reports