Using Intel® Visual Fortran to Create and Build Windows*-Based Applications
A newer version of this document is available. Customers should click here to go to the newest version.
Graphics Coordinates
Three coordinate systems describe the location of pixels on the screen:
Physical coordinates
Viewport coordinates
Window coordinates
This topic provides information on each of these coordinate systems.
In all three coordinate systems, the x-coordinate is listed before the y-coordinate.
Physical Coordinates
Physical coordinates are integers that refer to pixels in a window's client area. By default, numbering starts at 0, not 1. If there are 640 pixels, they are numbered 0-639.
Suppose your program calls SETWINDOWCONFIG to set up a client area containing 640 horizontal pixels and 480 vertical pixels. Each individual pixel is referred to by its location relative to the x-axis and y-axis, as shown in the following figure:
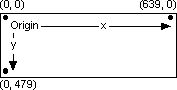
The upper-left corner is the origin. The x- and y-coordinates for the origin are always (0, 0).
Physical coordinates refer to each pixel directly and are therefore integers (that is, the window's client area cannot display a fractional pixel). If you use variables to refer to pixel locations, declare them as integers or use type-conversion routines when passing them to graphics functions. For example:
ISTATUS = LINETO( INT2(REAL_x), INT2(REAL_y))
If a program uses the default dimension of a window, the viewport (drawing area) is equal to 640x480. SETVIEWORG changes the location of the viewport's origin. You pass it two integers, which represent the x and y physical screen coordinates for the new origin. You also pass it an xycoord type that the routine fills with the physical coordinates of the previous origin. For example, the following line moves the viewport origin to the physical screen location (50, 100):
TYPE (xycoord) origin
  CALL SETVIEWORG(INT2(50), INT2(100), origin)
The effect on the screen is illustrated in the following figure:
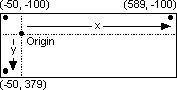
The number of pixels hasn't changed, but the coordinates used to refer to the points have changed. The x-axis now ranges from -50 to +589 instead of 0 to 639. The y-axis now covers the values -100 to +379.
All graphics routines that use viewport coordinates are affected by the new origin, including MOVETO, LINETO, RECTANGLE, ELLIPSE, POLYGON, ARC, and PIE. For example, if you call RECTANGLE after relocating the viewport origin and pass it the values (0, 0) and (40, 40), the upper-left corner of the rectangle would appear 50 pixels from the left edge of the screen and 100 pixels from the top. It would not appear in the upper-left corner of the screen.
SETCLIPRGN creates an invisible rectangular area on the screen called a clipping region. You can draw inside the clipping region, but attempts to draw outside the region fail (nothing appears outside the clipping region).
The default clipping region occupies the entire screen. The QuickWin Library ignores any attempts to draw outside the screen.
You can change the clipping region by calling SETCLIPRGN. For example, suppose you entered a screen resolution of 320x200 pixels. If you draw a diagonal line from (0, 0) to (319, 199), the upper-left to the lower-right corner, the screen looks like the following figure:

You could create a clipping region by entering:
CALL SETCLIPRGN(INT2(10), INT2(10), INT2(309), INT2(189))
With the clipping region in effect, the same LINETO command would put the line shown in the following figure on the screen:
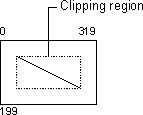
The dashed lines indicate the outer bounds of the clipping region and do not actually print on the screen.
Viewport Coordinates
The viewport is the area of the screen displayed, which may be only a portion of the window's client area. Viewport coordinates represent the pixels within the current viewport. SETVIEWPORT establishes a new viewport within the boundaries of the physical client area. A standard viewport has two distinguishing features:
The origin of a viewport is in the upper-left corner.
The default clipping region matches the outer boundaries of the viewport.
SETVIEWPORT has the same effect as SETVIEWORGSETCLIPRGN and combined. It specifies a limited area of the screen in the same manner as SETCLIPRGN, then sets the viewport origin to the upper-left corner of the area.
Window Coordinates
Functions that refer to coordinates on the client-area screen and within the viewport require integer values. However, many applications need floating-point values -- for frequency, viscosity, mass, and so on. SETWINDOW lets you scale the screen to almost any size. In addition, window-related functions accept double-precision values.
Window coordinates use the current viewport as their boundaries. A window overlays the current viewport. Graphics drawn at window coordinates beyond the boundaries of the window -- the same as being outside the viewport -- are clipped.
For example, to graph 12 months of average temperatures on the planet Venus that range from -50 to +450, add the following line to your program:
status = SETWINDOW(.TRUE., 1.0D0, -50.0D0, 12.0D0, 450.0D0)
The first argument is the invert flag, which puts the lowest y value in the lower-left corner. The minimum and maximum x- and y-coordinates follow; the decimal point marks them as floating-point values. The new organization of the screen is shown in the following figure:
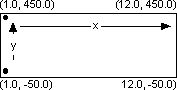
January and December plot on the left and right edges of the screen. In an application like this, numbering the x-axis from 0.0 to 13.0 provides some padding space on the sides and would improve appearance.
If you next plot a point with SETPIXEL_W LINETO_W or draw a line with, the values are automatically scaled to the established window.
To use window coordinates with floating-point values:
Set a graphics mode with SETWINDOWCONFIG.
Use SETVIEWPORT to create a viewport area. This step is not necessary if you plan to use the entire screen.
Create a real-coordinate window with SETWINDOWDOUBLE PRECISION invert flag and four LOGICAL, passing a x- and y-coordinates for the minimum and maximum values.
Draw graphics shapes with RECTANGLE_W and similar routines. Do not confuse RECTANGLE (the viewport routine) with RECTANGLE_W (the window routine for drawing rectangles). All window function names end with an underscore and the letter W (_W).
Real-coordinate graphics give you flexibility and device independence. For example, you can fit an axis into a small range (such as 151.25 to 151.45) or into a large range (-50000.0 to +80000.0), depending on the type of data you graph. In addition, by changing the window coordinates, you can create the effects of zooming in or panning across a figure. The window coordinates also make your drawings independent of the computer's hardware. Output to the viewport is independent of the actual screen resolution.