A newer version of this document is available. Customers should click here to go to the newest version.
Visible to Intel only — GUID: GUID-C1875F94-B022-4D5A-BB0A-07789091CBE1
Visible to Intel only — GUID: GUID-C1875F94-B022-4D5A-BB0A-07789091CBE1
Window: Survey Report
After running the Vectorization and Code Insights perspective, Intel Advisor generates a Survey report that helps you identify top time-consuming and non- or under-vectorized functions/loops.
Controls
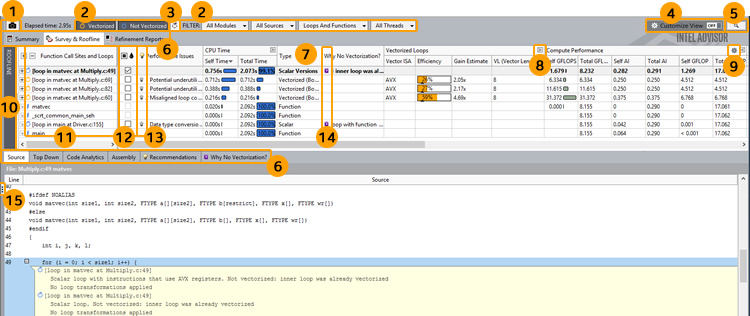
There are many controls available to help you focus on the data most important to you, including the following:
1 |
Click the control to save a read-only result snapshot you can view any time. Intel Advisor stores only the most recent analysis result. Visually comparing one or more snapshots to each other or to the most recent analysis result can be an effective way to judge performance improvement progress. To open a snapshot, choose File > Open > Result... |
|
2 |
Click the various Filter controls to temporarily limit displayed data based on your criteria. |
|
3 |
Click the control to view loops in non-executed code paths for various instruction set architectures (ISAs). Prerequisites:
|
|
4 |
This toggle control currently combines two features: The View Configurator and the Smart Mode filter.
|
|
5 |
Click the button to search for specific data. |
|
6 |
Click the tab to open various Intel Advisor reports or views. |
|
7 |
Right-click a column header to:
|
|
8 |
Click the toggle to show all available columns in a column set, and resume showing a limited number of preset columns in a column set. |
|
9 |
Click the control to:
For example, click the control in the Compute Performance column set to:
|
|
10 |
Click the control to show/hide a chart that helps you visualize actual performance against hardware-imposed performance ceilings, as well as determine the main limiting factor (memory bandwidth or compute capacity), thereby providing an ideal roadmap of potential optimization steps. |
|
11 |
Click a data row in the top of the Survey Report to display more data specific to that row in the bottom of the Survey Report. Double-click a loop data row to display a Survey Source window. To more easily identify data rows of interest:
|
|
12 |
Click a checkbox to mark a loop for deeper analysis. |
|
13 |
If present, click the image to display code-specific how-can-I-fix-this-issue? information in the Recommendations pane. |
|
14 |
If present, click the image to view the reason automatic compiler vectorization failed in the Why No Vectorization? pane. |
|
15 |
Click the control to show/hide the Workflow pane. |
|
 = Vectorized function
  = Vectorized loop
  = Scalar function
  = Scalar loop