A newer version of this document is available. Customers should click here to go to the newest version.
Visible to Intel only — GUID: GUID-A77625B5-BC82-4527-A736-60E62EAACC0A
Visible to Intel only — GUID: GUID-A77625B5-BC82-4527-A736-60E62EAACC0A
Run GPU-to-GPU Performance Modeling from Command Line
With Intel® Advisor, you can model performance of SYCL, OpenCL™, or OpenMP* target application running on a graphics processing unit (GPU) for a different GPU device without its CPU version. For this, run the GPU-to-GPU modeling workflow of the Offload Modeling perspective.
The GPU-to-GPU modeling analyzes only GPU compute kernels and ignores the application parts executed on a CPU. As a result, there are several changes in the modeling flow:
- Compute kernels characteristics are collected with the Intel Advisor GPU profiling capabilities.
- High-overhead features, such as call stack handling, cache simulation, data transfer simulation, dependencies analysis, are disabled.
- Instead of CPU-to-GPU data transfer simulation, memory objects transferred between host and device memory are traced.
Workflow
The GPU-to-GPU performance modeling workflow is similar to the CPU-to-GPU modeling and includes the following steps:
- Survey analysis measures execution time, cache, and GTI traffic using hardware counters for GPU-enabled kernels running on an Intel® Graphics.
- Characterization analysis measures the number of compute operations counting different GPU instructions separately for kernels running on a Intel Graphics. For example, it implements separate counters for hardware-implemented 32-bit math functions, such as SQRT, EXP, DIV.
- Performance Modeling analysis models performance of all kernels on a target GPU device, whether they are profitable or not.
Prerequisites
- Configure your system to analyze GPU kernels.
- Set Intel Advisor environment variables with an automated script to enable Intel Advisor command line interface.
Run the GPU-to-GPU Performance Modeling
To run the GPU-to-GPU performance modeling from command line, you can use one of the following methods:
- Method 1. Run a collection preset using Intel Advisor command line interface (CLI) to execute multiple analyses with a single command and control modeling accuracy.
- Method 2. Run analyses separately using Intel Advisor CLI if you need more advanced customization for each analysis.
- Method 3. Run Python* scripts if you need more customization for collection and modeling steps.
You can also run the GPU-to-GPU Offload Modeling from Intel Advisor graphical user interface (GUI). See Run Offload Modeling Perspective from GUI.
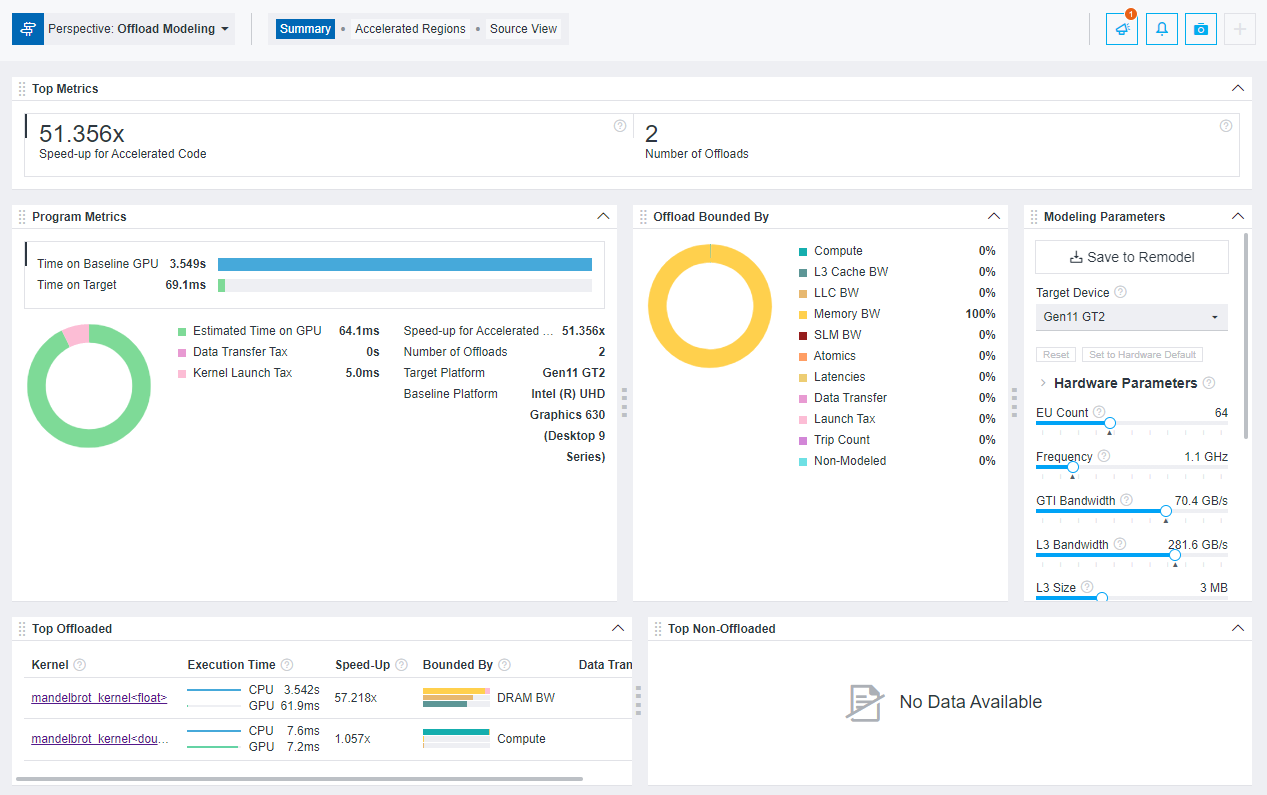
After you run the Offload Modeling with any method above, you can view the results in Intel Advisor graphical user interface (GUI), command line interface (CLI), or an interactive HTML report. For example, the interactive HTML report is similar to the following:
Method 1. Use Collection Preset
To run the collection preset for the GPU-to-GPU modeling, use the --gpu option with the --collect=offload action. When you run the collection, it sequentially runs data collection on a GPU and performance modeling steps. The specific analyses and options depend on the accuracy level you specify for the collection.
Note: In the commands below, make sure to replace the myApplication with your application executable path and name before executing a command. If your application requires additional command line options, add them after the executable name.
For example, to run the GPU-to-GPU modeling with the default (medium) accuracy level:
- On Linux* OS:
advisor --collect=offload --gpu --project-dir=./advi_results -- ./myApplication - On Windows* OS:
advisor --collect=offload --gpu --project-dir=.\advi_results -- myApplication.exe
The collection progress and commands for each analysis executed will be printed to a terminal or a command prompt. When the collection is finished, you will see the result summary.
You can also specify a different accuracy level to change analyses to run and their options. Available accuracy levels are low, medium (default), and high.
For example, run the high accuracy level:
advisor --collect=offload --accuracy=high --gpu --project-dir=./advi_results -- ./myApplication
If you want to see the commands that are executed at each accuracy level, you can run the collection with the --dry-run and --gpu options. The commands will be printed to a terminal or a command prompt.
For details about each accuracy level, see Offload Modeling Accuracy Levels in Command Line.
Method 2. Use per-Analysis Collection
You can collect data and model performance for your application by running each Offload Modeling analysis in a separate command for more advanced customization. To enable the GPU-to-GPU modeling, use the --profile-gpu option for each analysis you run.
Consider the following workflow example. Using this example, you can run the Survey, Trip Counts, and FLOP analyses to profile an application running on a GPU and the Performance Modeling to model its performance on Intel® Iris® Xe MAX graphics (gen12_dg1 configuration).
Note: In the commands below, make sure to replace the myApplication with your application executable path and name before executing a command. If your application requires additional command line options, add them after the executable name.
On Linux OS:
- Run the Survey analysis.
advisor --collect=survey --profile-gpu --project-dir=./advi_results -- ./myApplication - Run the Trip Counts and FLOP analyses with data transfer estimation.
advisor --collect=tripcounts --profile-gpu --flop --target-device=gen12_dg1 --data-transfer=light --project-dir=./advi_results -- ./myApplication - Run the Performance Modeling analysis.
advisor --collect=projection --profile-gpu --config=gen12_dg1 --project-dir=./advi_resultsYou will see the result summary printed to the command prompt.
On Windows OS:
- Run the Survey analysis.
advisor --collect=survey --project-dir=.\advi_results -- myApplication.exe - Run the Trip Counts and FLOP analyses with data transfer.
advisor --collect=tripcounts --profile-gpu --flop --stacks --target-device=gen12_dg1 --data-transfer=light --project-dir=.\advi_results -- myApplication.exe - Run the Performance Modeling analysis.
advisor --collect=projection --profile-gpu --config=gen12_dg1 --project-dir=.\advi_resultsYou will see the result summary printed to the command prompt.
Method 3. Use Python* Scripts
Intel Advisor has three scripts that use the Intel Advisor Python* API to run the Offload Modeling - run_oa.py, collect.py, analyze.py. You can run the scripts with the advisor-python command line interface of the Intel Advisor or with your local Python 3.6 or 3.7.
To enable the GPU-to-GPU modeling, use the --gpu option for each script you run.
You can run the Offload Modeling using different combinations of the scripts and/or the Intel Advisor CLI. For example:
- Run run_oa.py to profile application and model its performance.
- Run the collect.py to profile application and analyze.py to model its performance. Re-run analyze.py to remodel with a different configuration.
- Run the Intel Advisor CLI to collect performance data and analyze.py to model performance. Re-run analyze.py to remodel with a different configuration.
- Run run_oa.py to collect data and model performance for the first time and run analyze.py to remodel with a different configuration.
Consider the following examples of some typical scenarios with Python scripts.
Note: In the commands below, make sure to replace the myApplication with your application executable path and name before executing a command. If your application requires additional command line options, add them after the executable name.
Example 1. Run the run_oa.py script to profile an application on GPU and model its performance for Intel® Iris® Xe MAX graphics (gen12_dg1 configuration).
- On Linux OS:
advisor-python $APM/run_oa.py ./advi_results --gpu --config=gen12_dg1 -- ./myApplication - On Windows OS:
advisor-python %APM%\run_oa.py .\advi_results --gpu --config=gen12_dg1 -- myApplication.exe
You will see the result summary printed to the command prompt.
Example 2. Run the collect.py to profile an application on GPU and run the analyze.py to model its performance for Intel® Iris® Xe MAX graphics (gen12_dg1 configuration).
- On Linux OS:
- Collect performance data.
advisor-python $APM/collect.py ./advi_results --gpu --config=gen12_dg1 -- ./myApplication - Model application performance.
advisor-python $APM/analyze.py ./advi --gpu --config=gen12_dg1You will see the result summary printed to the command prompt.
- Collect performance data.
- On Windows OS:
- Collect performance data.
advisor-python %APM%\collect.py .\advi_results --collect=basic --gpu --config=gen12_dg1 -- myApplication.exe - Model application performance.
advisor-python %APM%\analyze.py .\advi_results --gpu --config=gen12_dg1You will see the result summary printed to the command prompt.
- Collect performance data.
View the Results
Once the Intel Advisor finishes the analyses, the result is available in the following formats:
- Review the result summary and a result file location printed to a command prompt or a terminal.
- Review the project result in the Intel Advisor GUI generated to the project directory.
- Review HTML reports generated to the <project-dir>/e<NNN>/report directory. View the detailed information about HTML reports in Work with Standalone HTML Reports.
- Review a set of reports generated to the <project-dir>/e<NNN>/pp<NNN>/data.0 directory. The directory includes the main report in HTML format named as report.html and a set of CSV files with detailed metric tables.
For example, the result in the Intel Advisor GUI looks as follows:
To explore the interactive HTML report, you can download precollected Offload Modeling reports and examine the results and structure.
See Explore Offload Modeling Results for details about available result formats and Explore Performance Gain from GPU-to-GPU Modeling for details about the GPU-to-GPU modeling result.