A newer version of this document is available. Customers should click here to go to the newest version.
Visible to Intel only — GUID: GUID-3DD0163E-0885-490A-98E8-A22328B2F07E
Visible to Intel only — GUID: GUID-3DD0163E-0885-490A-98E8-A22328B2F07E
Work with Standalone HTML Reports
Export the interactive Intel® Advisor HTML reports that you can share or open on a remote machine using your web browser.
Offload Modeling HTML Reports
For the Offload Modeling perspective, you can export two types of HTML reports:
- An interactive HTML report that represents results in the same structure as in graphical user interface (GUI) and enables you to switch between Offload Modeling and Intel Advisor perspective results if you collect your data for an application running on GPU.
- A legacy HTML report that enables you to view an extended set of metrics for your offloaded and non-offloaded code regions
Export Offload Modeling HTML Reports
If you run Offload Modeling perspective from command line interface (CLI)Intel Advisor automatically saves both types of HTML reports. Once the execution is complete, you can find the reports stored in the following directories:
- <project-dir>/e<NNN>/report/advisor-report.html for interactive HTML report
- <project-dir>/e<NNN>/report/report.html for legacy HTML report
If you run Offload Modeling perspective from GUI, Intel Advisor automatically saves only the legacy report into the <project-dir>/e<NNN>/pp000/data.0 directory.
To get an interactive HTML report for results collected in the GUI, you can export the report using CLI. For example, to export an interactive HTML report as offload_modeling_report.html from the advi_results project, run the following command:
advisor --report=all --project-dir=./advi_results --report-output=./offload_modeling_report.html
where:
- --project-dir option specifies the path to your project directory where you collected the results.
- --report-output option specifies the directory to save the HTML report to and a file name. This option is required.
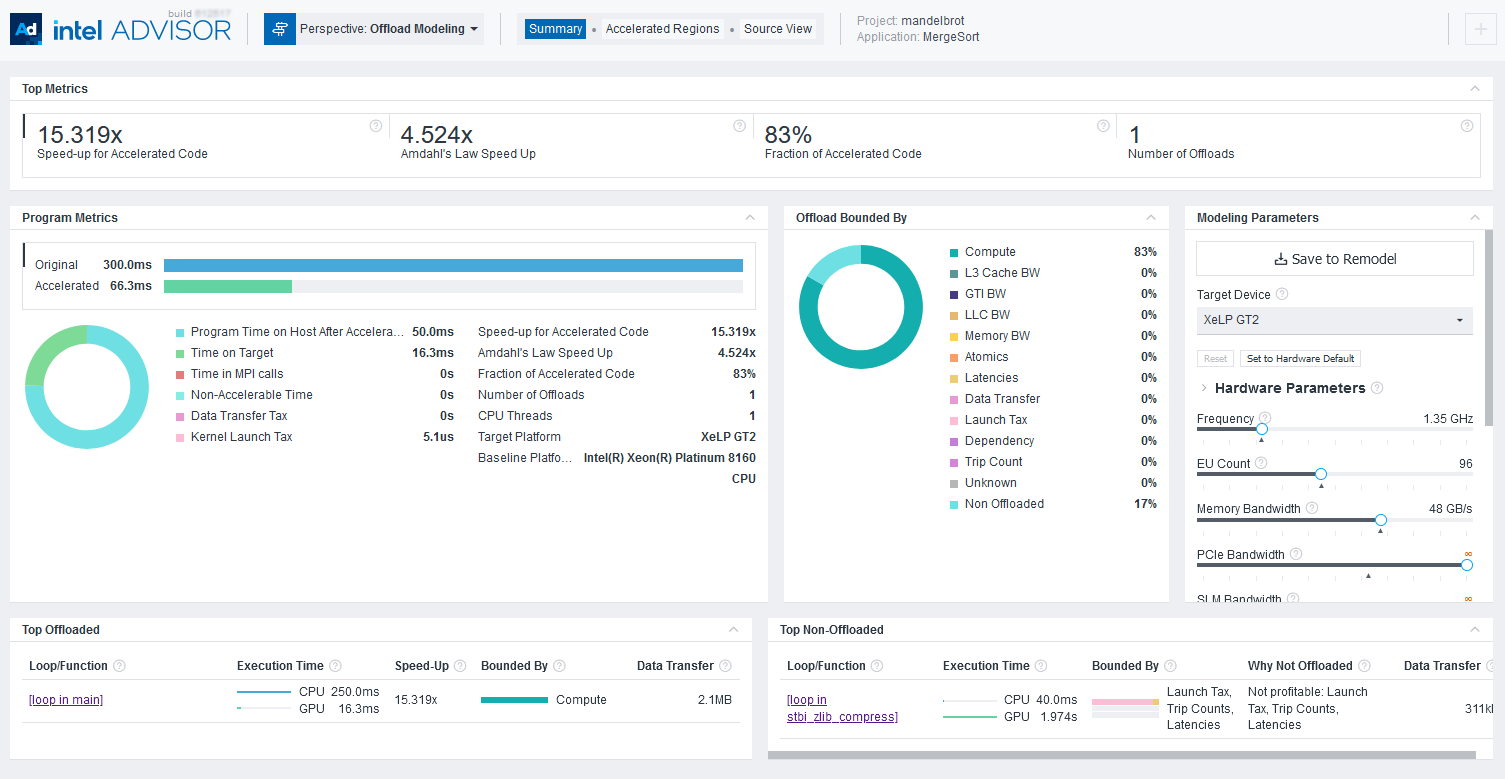
View Offload Modeling Interactive HTML Report
The structure of results in Offload Modeling interactive HTML report is similar to a GUI report with the following controls available:
- If you run both GPU-to-GPU Offload Modeling and GPU Roofline Insights perspectives or the GPU Roofline Insights perspective with the Performance Modeling analysis enabled, you can switch between the results using the Perspective drop-down menu in the top left corner of the report.
- Switch between report tabs to view estimated performance on a target accelerator. The Summary tab shows data for the whole application, the Accelerated Regions tab shows data per code region or kernel in detail.
- Use the sliders in the Modeling Parameters pane to change the hardware parameter values and use the updated target device configuration for remodeling. See the section below for details.
To explore the interactive HTML report, you can download precollected Offload Modeling reports and examine the results and structure.
For details about results interpretation, see Explore Offload Modeling Results.
Remodel Performance for a Custom Target Device
The interactive HTML report includes a Modeling Parameter pane, which you can use to examine the target device characteristics and modify the parameters as needed to model application performance for the future or a custom target:
- Change the parameter values using the sliders.
- Click Save to Remodel to save the custom device configuration.
- Copy the command line generated under the hardware parameter list.
- Paste the command to a terminal or command prompt and run it to model your application performance on a custom device.
- View the updated interactive HTML report generated as <project-dir>/e<NNN>/report/advisor-report.html.
See Model Application Performance on a Custom Target GPU Device for a full workflow and pane description.
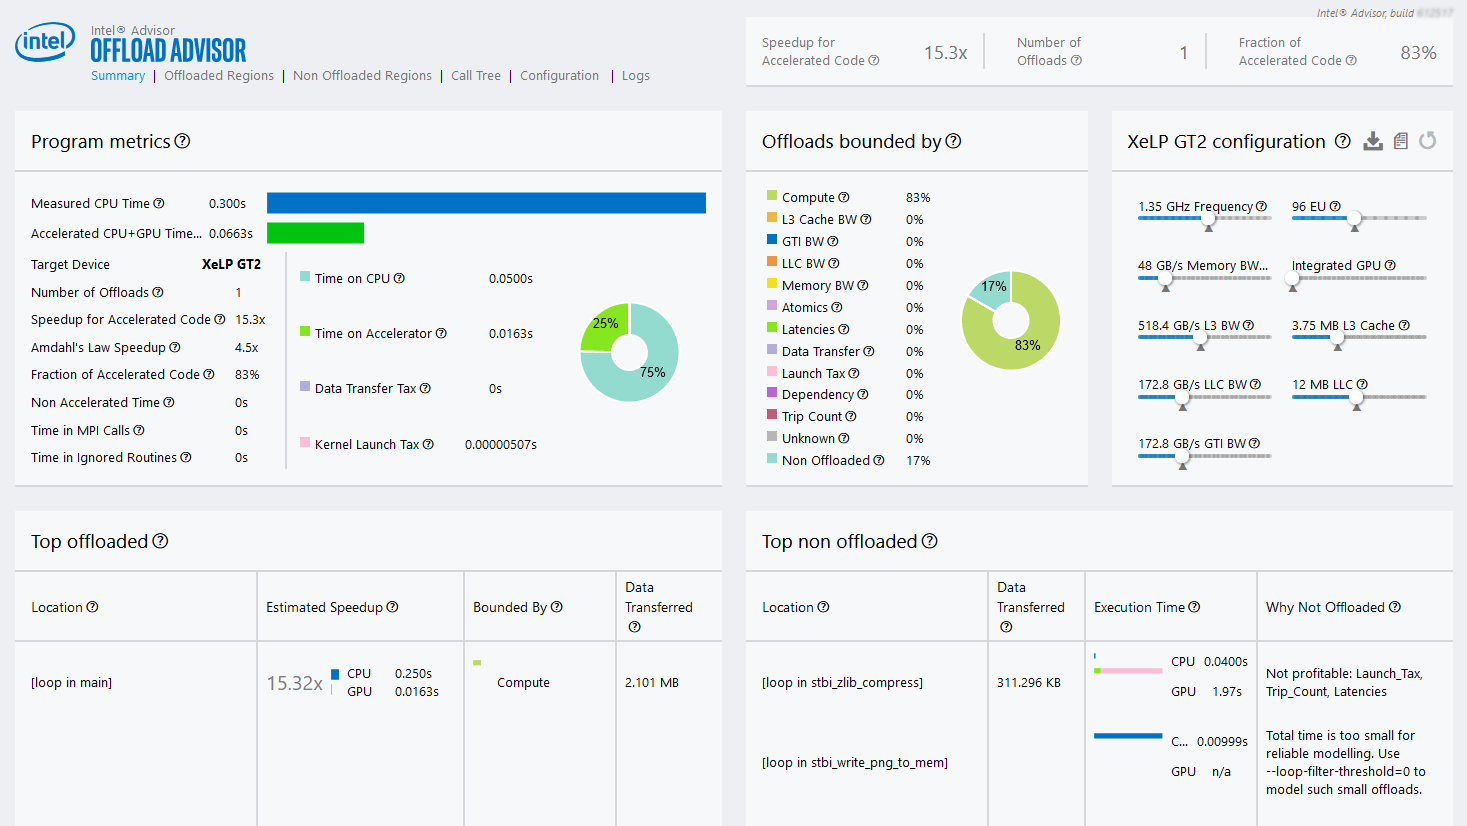
View Offload Modeling Legacy HTML Report
You can switch between the tabs to explore metrics for offloaded and non-offloaded code regions, estimate data transfer taxes, view or download configuration file for the selected target accelerator and examine execution logs.
GPU Roofline HTML Reports
Intel Advisor enables you to export two types of HTML reports:
- An interactive HTML report that represents results in the same structure as in GUI and enables you to switch between Offload Modeling and GPU Roofline Insights perspective results if you collect your data for an application running on GPU. This report contains grid data with GPU metrics, a GPU Roofline chart, GPU Details tab containing per-kernel compute and memory metrics, and a source view.
- An HTML Roofline chart that enables you to visualize your application performance on an interactive Roofline chart and view your platform information.
Export HTML GPU Roofline Chart using GUI
To export an interactive HTML GPU Roofline chart using GUI, do the following:
- Run GPU Roofline Insights perspective.
- Select FLOAT or INT data type using the filter pane at the top of the Roofline chart. You cannot change the data type after the report is generated.
- Export the project results by clicking the
 button and selecting Export as HTML option. To share your result as an image, consider selecting Export as SVG option and setting up the resolution.
 - Save the HTML report and open it in your browser.
Export GPU Roofline Report using CLI
Once the perspective executes, you can export both types of HTML reports using CLI.
To export an interactive HTML report as gpu_roofline_report.html from the ./advi_results project, run the following command:
advisor --report=all --project-dir=./advi_results --report-output=./gpu_roofline_report.html
where:
- --project-dir option specifies the path to your project directory where you collected the results.
- --report-output option specifies the directory to save the HTML report to and a file name. This option is required.
To export an HTML GPU Roofline chart for floating-point operations data as gpu_roofline.html, make sure that the value of the --project-dir option specifies the path to your project directory and run the following command:
advisor --report=roofline --gpu --project-dir=./advi_results --report-output=./gpu_roofline.html --data-type=float
where:
- --project-dir option specifies the path to your project directory where you collected the results.
- --report-output option specifies the directory to save the HTML report to and a file name. This option is required.
- --gpu option generates a Roofline chart for GPU kernels. This option is required.
- --data-type=<type> option specifies the data type to show in the Roofline chart. Available types are float (default) or int. You cannot change the data type after the report is generated.
Once report generation is complete, open it in your preferred web browser.
View Interactive HTML Report for GPU Roofline
You can switch between the Summary and GPU Roofline Regions tabs to examine how your application executes on a GPU, identify top hotspots, and define room for their optimization using a Roofline chart and GPU grid metrics.
To explore the interactive HTML report, you can download a precollected GPU Roofline report and examine the results and structure.
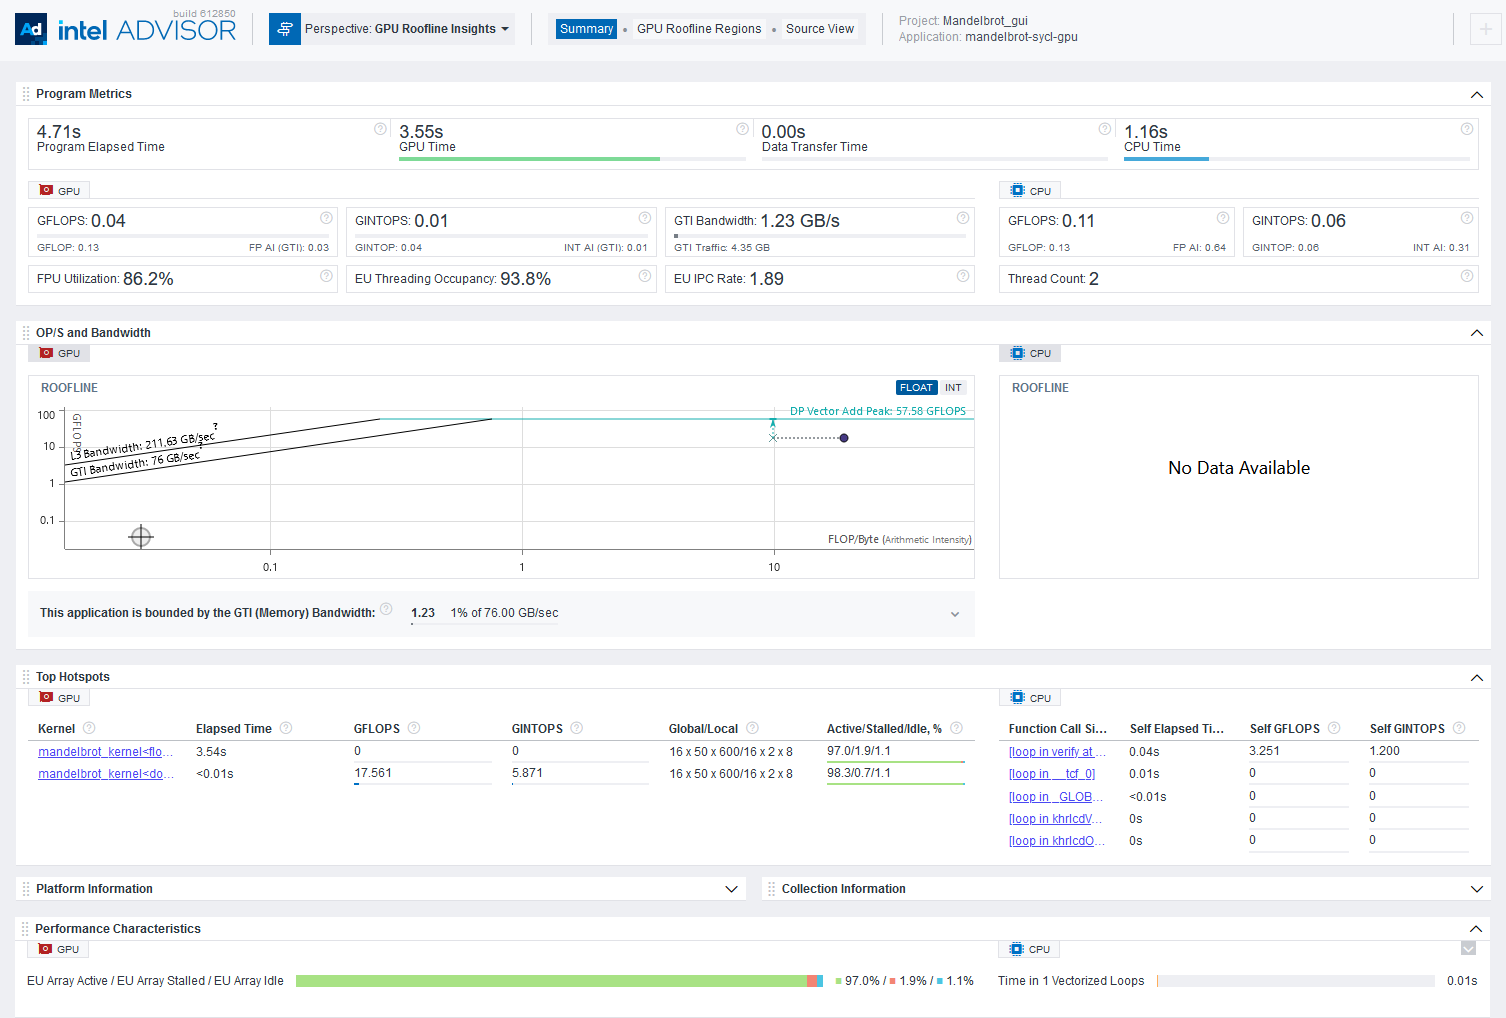
For details about result interpretation, see Explore GPU Roofline Results.
View HTML GPU Roofline Chart
Identify top hotspots and room for optimization of your application running on GPU using a Roofline chart and view the application execution and performance details in the Performance Metrics Summary drop-down section.
For details on results interpretation, see Examine Bottlenecks on a GPU Roofline Chart.
HTML Roofline Chart for CPU Roofline
Export an interactive Roofline chart for CPU / Memory Roofline Insights perspective to share it or open on a remote machine using your web browser. This report enables you to visualize performance of your application running on CPU, identify factors limiting your application performance, and define headroom for optimization at different memory levels.
Export HTML CPU Roofline Chart Using GUI
To export an interactive HTML CPU Roofline chart using GUI, do the following:
- Run CPU / Memory Roofline Insights perspective.
- Select FLOAT or INT data type using the filter pane at the top of the Roofline chart. You cannot change the data type after the report is generated.
- Export the project results by clicking the button and selecting Export as HTML option. To share your result as an image, consider selecting Export as SVG option and setting up the resolution.
- Save the HTML report and open it in your browser.
Export HTML CPU Roofline Chart Using CLI
Intel Advisor enables you to export an HTML CPU Roofline chart using CLI. For example, to export an interactive CPU Roofline chart for floating-point operations data as roofline.html, make sure that the value of the --project-dir option specifies the path to your project directory and run the following command:
advisor --report=roofline --project-dir=./advi_results --report-output=./roofline.html
where:
- --project-dir option specifies the path to your project directory where you collected the results.
- --report-output option specifies the directory to save the HTML report to and a file name. This option is required.
In addition to the options used in the example command, you can use the following additional options to extend the report with more data:
- Use the --with-stack option to enable call stack data in the HTML report. Use it if you collected CPU Roofline with call stack data using the --stacks option.
- Use the --data-type=<type> option to specify the data type to show in the Roofline chart. Available types are float (default), int, mixed. You cannot change the data type after the report in generated.
- Use the --memory-level=<string> option to show specific memory levels in the HTML report by default. Available memory levels are L1 (default), L2, L3, and DRAM. You can combine several memory levels with an underscore (for example, L1_L2). Use this if you generated the Memory-level CPU Roofline with --enable-cache-simulation.
Once report generation is complete, open it in your preferred web browser.
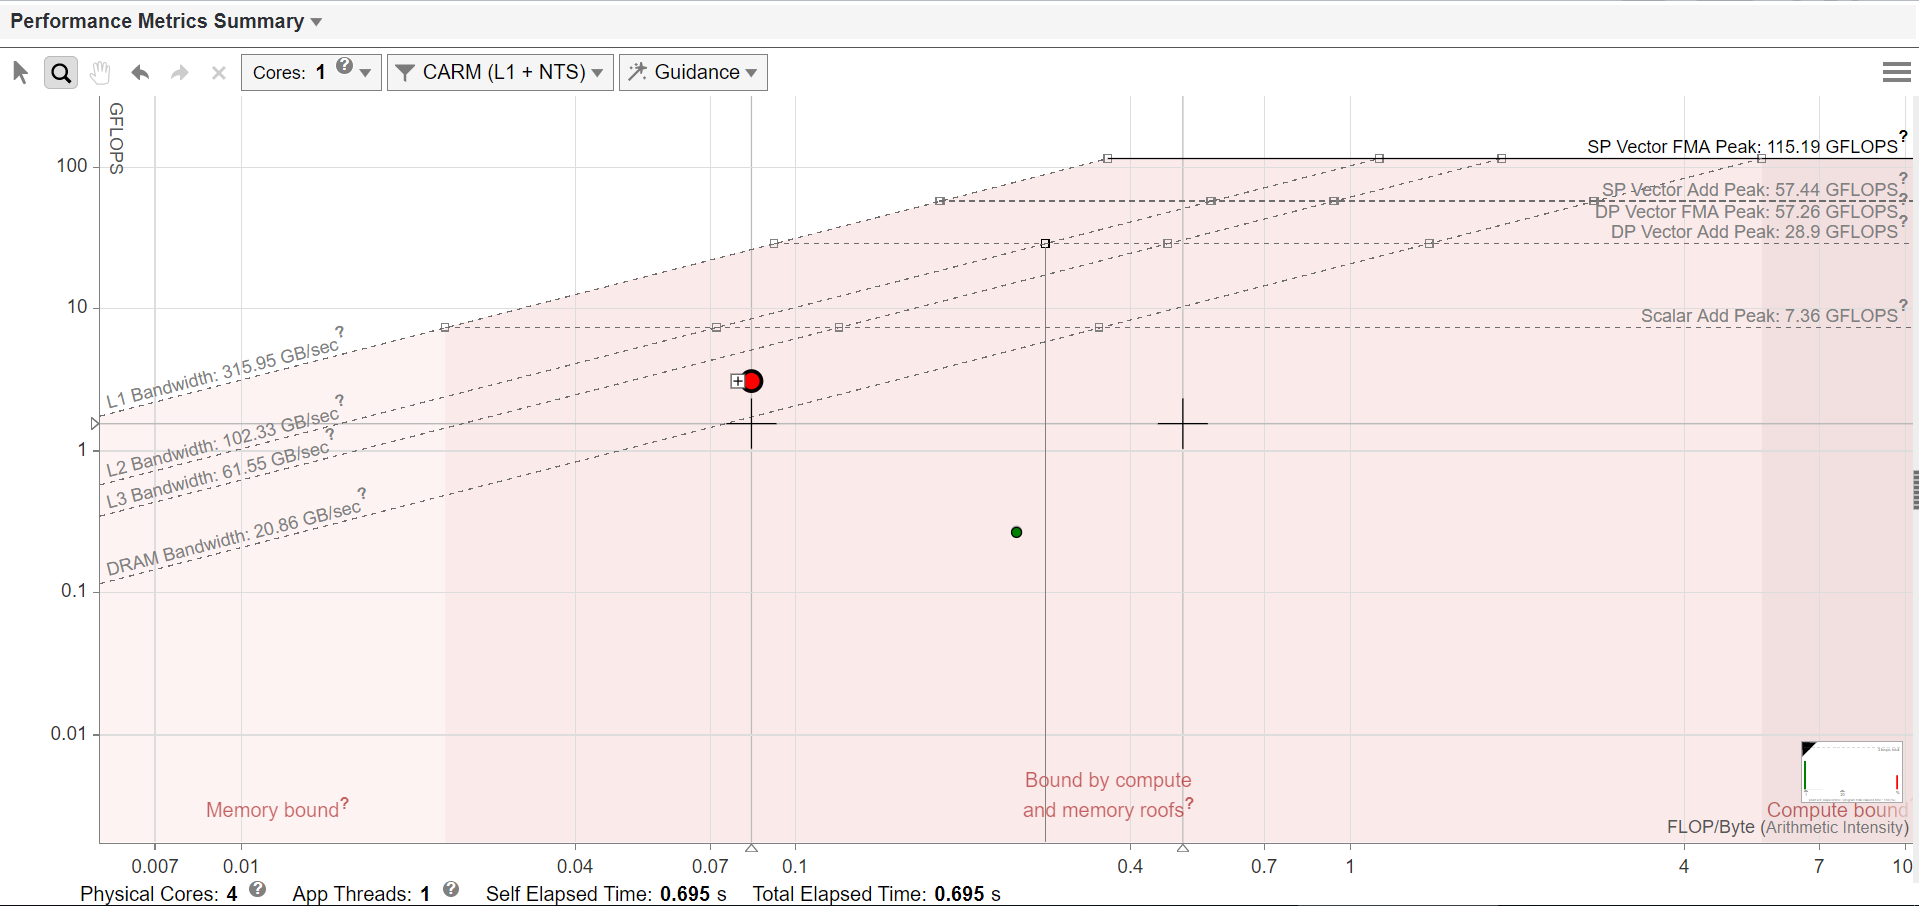
View CPU HTML Roofline Chart
Identify hotspots for optimization and room for improvement of your application running on CPU and view the application execution and performance details in the Performance Metrics Summary drop-down section.
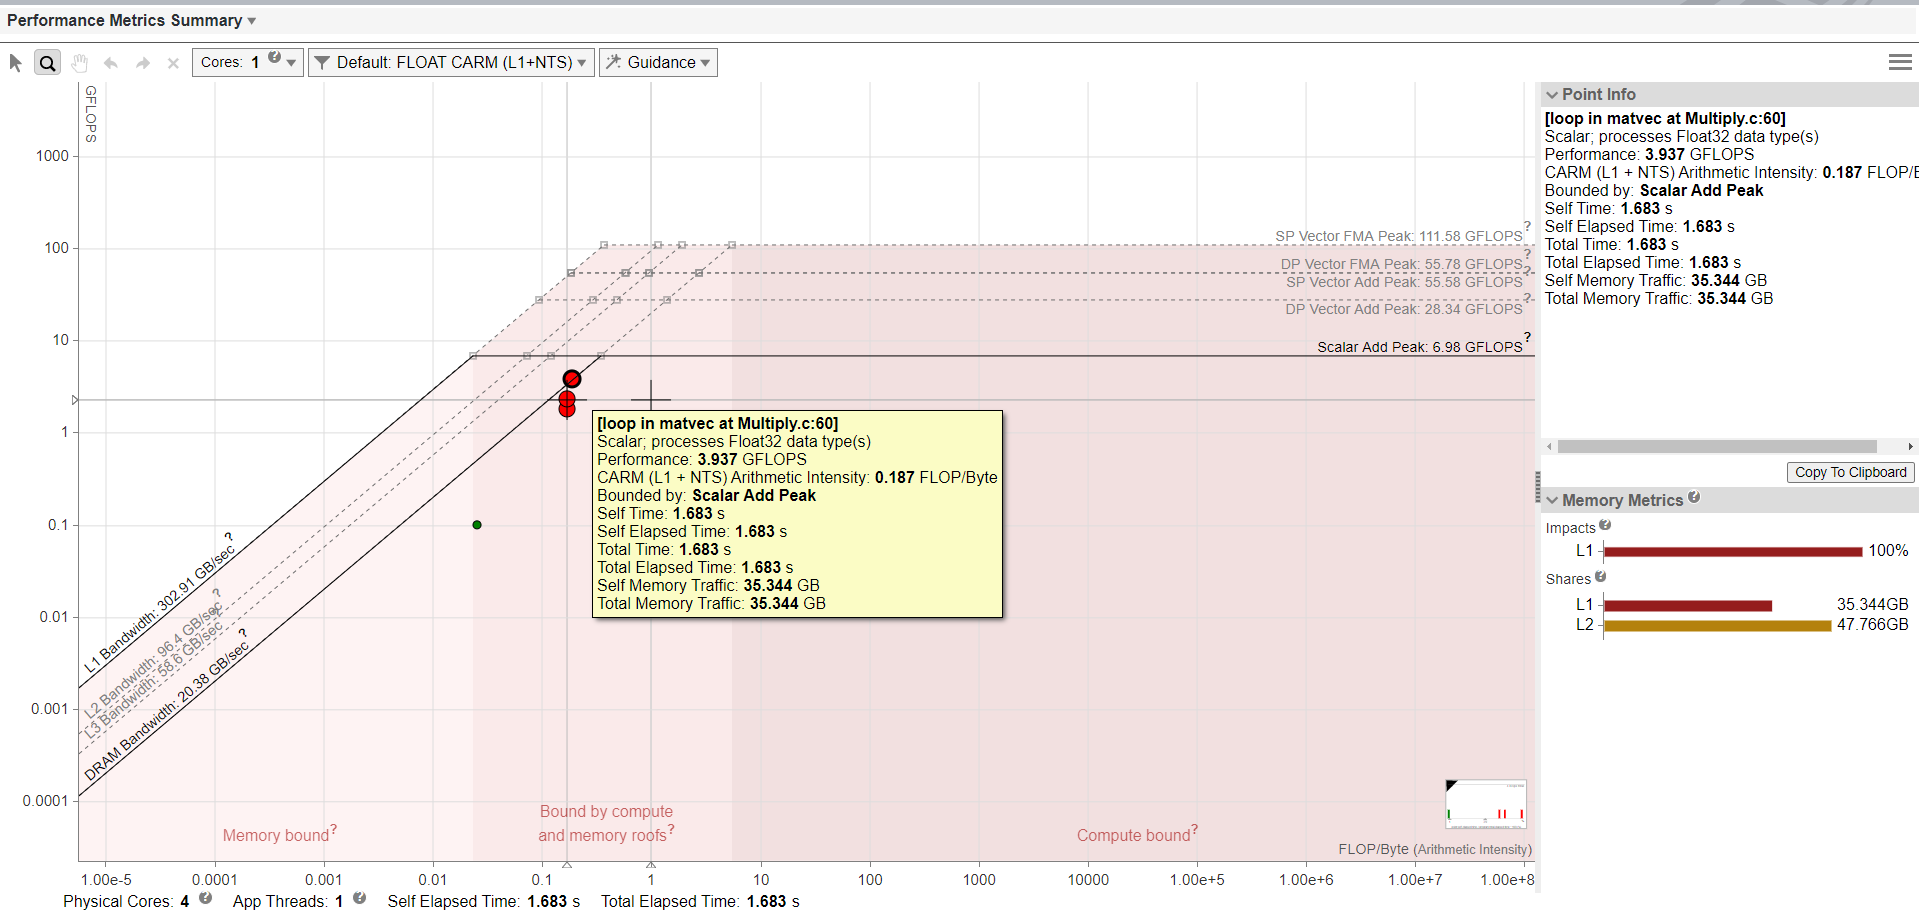
For more information on interpretation of Roofline charts, see Examine Bottlenecks on CPU Roofline Chart.