A newer version of this document is available. Customers should click here to go to the newest version.
Stitch Stacks for Intel® oneAPI Threading Building Blocks or OpenMP* Analysis
Use the Stitch stacks option to restore a logical call tree for Intel® oneAPI Threading Building Blocks(oneTBB ) or OpenMP* applications by catching notifications from the runtime and attach stacks to a point introducing a parallel workload.
Typically the real execution flow in the applications based on Intel® oneAPI Threading Building Blocks(oneTBB ) or OpenMP is very different from the code flow. During the user-mode sampling and tracing analysis of an oneTBB -based application or an OpenMP application using Intel runtime libraries, the Intel® VTune™ Profiler automatically enables the Stitch stacks option. To view the OpenMP or oneTBB objects hierarchy, explore the data provided in the Top-down Tree pane.
To analyze a logically structured OpenMP call flow, make sure to compile and run your code with the Intel® Compiler 13.1 Update 3 or higher (part of the Intel Composer XE 2013 Update 3).
Stack stitching is available when you run the application from the VTune Profiler (the Launch Application target type). It does not work when attaching to the application (the Attach to Process target type).
You may want to disable stack stitching, for example, to minimize the collection overhead. To do this for your predefined user-mode sampling and tracing analysis type (for example, Hotspots or Threading), you need to create a new custom analysis configuration and deselect the Stitch stacks option in the Custom Analysis configuration. You may use the same modified GUI analysis configuration for command line analysis. For this, just click the Command Line… button in the Configure Analysis window and copy the generated command line to run it from the terminal window. Alternatively, you can manually configure the command line for a custom runss analysis using the knob stack-stitching=false option like this:
> vtune -collect-with runss -knob cpu-samples-mode=stack -knob stack-stitching=false -knob mrte-type=java,dotnet,python -app-working-dir <path> -- <application>
In this case, the Top-down Tree pane (or top-down report) displays separate entries for OpenMP worker threads.
Examples
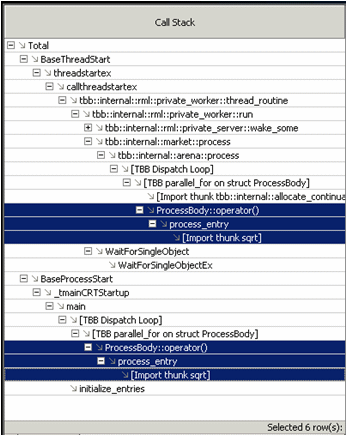
Call stack in the Top-down Tree pane with the Stitch stacks option disabled:

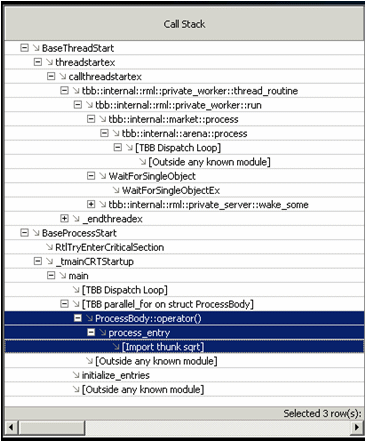
Call stack in the Top-down Tree pane with the Stitch stacks option enabled (default behavior):
