A newer version of this document is available. Customers should click here to go to the newest version.
Group and Filter Data
Analyze the data collected with the Intel® VTune™ Profiler by filtering in areas of interest and grouping the data by specific program units (modules, functions, frame domains, and so on).
VTune Profiler provides powerful filtering mechanisms that enable you to focus on specific objects or time regions. This helps you focus only on the areas of interest and at the same time speeds up the GUI response when a smaller data set is processed.
Filter by Objects
To filter by particular program units (functions, modules, and so on), use any of the following options:
Context menu options: Select objects of interest in the grid, right-click and choose the Filter In by Selection context menu option to exclude all objects from the view other than the objects you selected. And conversely, choosing the Filter Out by Selection hides the selected data. The filter bar at the bottom is updated to show the percentage of the displayed data by a certain metric.
For example, you want to filter in the grid by the most time-consuming function sphere_intersect:

When the filter is applied, the filter bar shows that you see only 24.9% of the collected CPU Time data.

Filter toolbar options: Select a program unit in the filtering drop-down menu (process, module, thread) to filter out your grid and Timeline view for displaying the data for this particular program unit. For example, if you select the analyze_locks process introducing 51.5% of the CPU Time, the result data will display statistics for this module only and the filter bar provides an indicator that only 51354% of the CPU Time data is currently displayed:

Filter by Time Regions
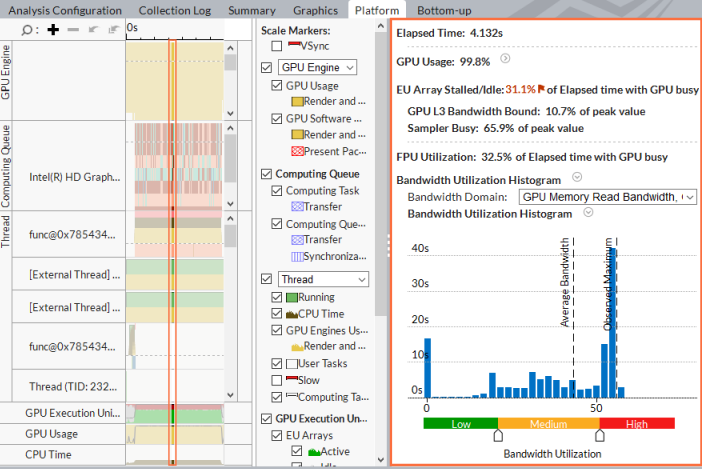
You can narrow down your analysis to particular regions on the timeline. For example, you may select an area of interest on the Timeline pane in the GPU Compute/Media Hotspots viewpoint, right-click and select the Zoom In by Selection or Zoom In and Filter In by Selection context menu option:

The context summary on the right will be updated for the selected time range and the filter toolbar will show the percentage of the data (per the default metric for this viewpoint) displayed.
Group Data
You can organize a view to focus on the sequence of data you need using the Grouping menu. The available groups depend on the analysis type and viewpoint:

For example, if you want to view the collected data for the modules you develop, you may select the Module/Function/Call Stack granularity, identify the hottest functions in your modules, and then switch to the Function/Thread/Logical Core/Call Stack granularity to see which CPUs your hot functions were running on.
VTune Profiler provides a set of pre-configured granularities that could be semantically divided into the following groups:
Groups targeted for analysis |
Description |
|---|---|
Basic |
Identify function hotspots and distinguish problem call stacks. For most viewpoints, Function level is the default. If application modules have debug information, you can rely on functions shown as hotspots. When debug information is incomplete or missing, you may see a number of <unknown> functions, or samples collected on internal functions of a module might be attributed to adjacent exported functions. Examples: Function/Call Stack Source Function/Function/Call Stack for analyzing all instances of the inline and JITed functions |
Multi-threading analysis |
Analyze hotspots in multi-threaded applications from the function, OS (Threads) or HW (Packages, Core, Threads) perspectives. Examples: Function/Thread/Logical Core/Call Stack for detecting anomalies of the function execution on different threads Function/Package/Logical Core/Thread/Call Stack for identifying Interconnect/NUMA issues on multi-processor systems Physical Core/Logical Core/Function/Call Stack for identifying specific hyper-threading issues Physical Core/Thread/Function/Call Stack and Thread/Physical Core/Function for identifying issues caused by thread migration between cores |
Frame analysis |
Identify slow and fast frames. Examples: Frame Domain/Frame Duration Type/Function/Call Stack Frame Domain/Frame Duration Type/Frame/Function/Call Stack |
OpenMP* analysis |
Identify hotspots called from OpenMP regions. Examples: OpenMP Region/OpenMP Barrier-to-Barrier Segment/Function/Call Stack for identifying load imbalance between different segments OpenMP Region/OpenMP Region Duration Type/Function/Call Stack for analyzing fast/slow OpenMP region instances |
GPU analysis |
Analyze the CPU activity while the GPU was either idle or executing some code Examples: Render and GPGPU Packet Stage / Function / Call Stack Render and GPGPU Packet Stage / Thread / Function / Call Stack |
Typically, you start your analysis with the Summary window where clicking an object of interest opens the grid pre-grouped in the most convenient way for analysis.
If the pre-configured grouping levels do not suit your analysis purposes, you can create your own grouping levels by clicking the Customize Grouping button and configuring the Custom Grouping dialog box.