A newer version of this document is available. Customers should click here to go to the newest version.
Problem: Unexpected Paused Time
You may see unexpected Paused time in the Timeline pane even though you did not add any calls to the __itt_pause() API or manually paused the analysis target. For example:

This may happen when collecting call stacks with hardware event-based sampling (EBS).
Cause
In the above example, the application called __itt_pause() at about the 22 sec mark. But the other, smaller pauses were inserted by the VTune Profiler, which temporarily pauses profiling when data generation rate exceeds data spill rate and it is about to lose data. The data is flushed and then the collection resumes. In the paused regions, your application is not executing: the VTune Profiler lets the application exhaust its current quanta and then prevents it from being scheduled on the CPU until all the data has been saved to a file.
Solution
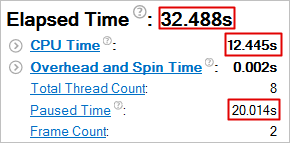
You can ignore this injected paused time. For example, in the Summary information below, you can see that Paused Time is part of the Elapsed Time, but is not included in CPU Time.
