A newer version of this document is available. Customers should click here to go to the newest version.
Window: CPU C/P States - Platform Power Analysis
To access this window: Select the Platform Power Analysis viewpoint and click the CPU C/P States sub-tab in the result tab.
Use the CPU C/P States window to:
- Analyze the amount of time spent in each sleep state (C-State) and processor frequency (P-State).
- Identify which core spent time at what frequency.
- Understand which cores were active during which timeframes during data collection.
- Review the state residency by core, module, or package.
- Explore how the state and frequency changed over time.
Platform Power Analysis viewpoint is available as part of energy analysis. Collecting energy analysis with Intel® SoC Watch is available for target Android*, Windows*, or Linux* devices. Import and viewing of the Intel SoC Watch results is supported with any version of the VTune Profiler.
CPU C/P States Pane
The CPU C/P States pane shows the time spent in sleep states (C-States) and at each processor frequency (P-State). Intel SoC Watch can collect sleep states as requested by the OS (ACPI C-States) as well as the actual states used at the hardware level on a Windows* system. The data can be displayed per core or per package using the Grouping drop-down. Click the expand![]() /collapse
/collapse![]() buttons in the data columns to expand or hide the columns of data for ACPI C-States, hardware C-State, and P-States. You can change the unit displayed by right-clicking a data cell and selecting the Show Data As option to select an alternate unit.
buttons in the data columns to expand or hide the columns of data for ACPI C-States, hardware C-State, and P-States. You can change the unit displayed by right-clicking a data cell and selecting the Show Data As option to select an alternate unit.
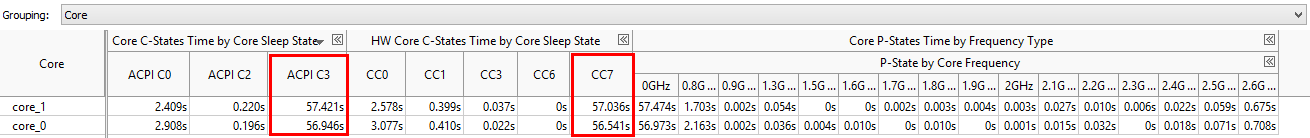
For example, if you are analyzing an idle scenario, you would use this report to see if most of the collection time was spent in the deepest possible sleep state. The time spent in CPU states is shown in the Core C-States Time by Core Sleep State columns (CC0-CCn for cores, MC0-MCn for modules, and PC0-PCn for packages). C0 represents the active state and Cn represents a sleep state, where the larger the number, the deeper the sleep state. Spending more time in deeper sleep states (C1-Cn) provides greater power savings. In the example below, both cores spent the most time in the deepest CPU sleep state C7, which corresponds to the OS request for the deepest sleep state ACPI C3. This is the desired result when the system being tested is idle. Expand the columns under P-State by Core Frequency to read the full values for the processor frequencies. Time in 0GHz indicates the time the processor was not running (total time in sleep states).
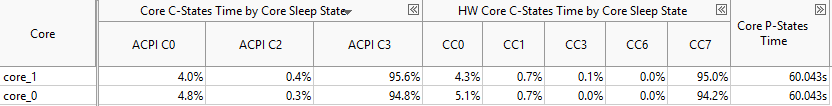
Right-click in a column and select Show Data As > Percent to view the data in that column as a percent of the total time rather than in seconds. If the core spent a higher than expected percentage of time in an unexpected state, you can look at the timeline to identify when the core was in that state and then switch to the Core Wake-ups window to identify reasons for the change in state.
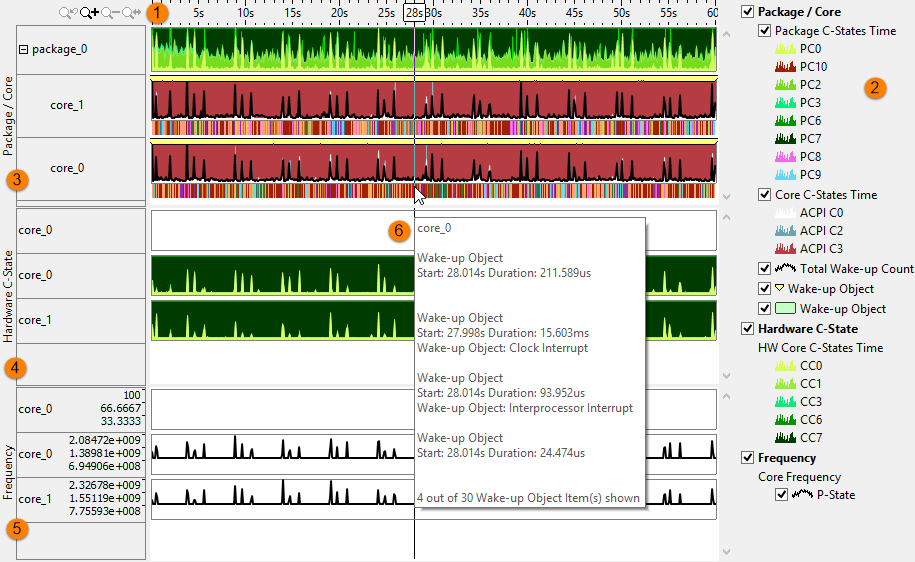
Timeline Pane
The Timeline pane graphically displays the C-States of each core, at each point in time. Filters applied on a timeline in one window are applied on all other windows within the viewpoint. This is useful if you identify an issue on one tab and want to see how the issue impacts the metrics shown on a different tab.
 |
Toolbar | Navigation control to zoom in/out on the view on areas of interest. For more details on the Timeline control, see Managing Timeline View. |
 |
Legend | Types of data presented on the timeline. Filter in/out any type of data presented on the timeline by selecting/deselecting corresponding check boxes. For example, each state is a different color and you may only be interested in the time spent in the active state. You can also filter in and out the hardware or package/core data if you are only interested in frequency metrics. The Wake-up Object marker shows processor wake-ups on the timeline. Hover over a yellow marker to see the time when the sleep state change happened and the name of the wake-up object. |
 |
Package/Core C-states | Graphical representation of the sleep states in each core and in the overall package. Each state is a different color, which can be filtered using the legend. Hover over the band to view the total wake-up count. Click the |
 |
Hardware C-states | Graphical representation of the sleep states on the hardware. Each state is a different color, which can be filtered using the legend. |
 |
Frequency (by core) | Core frequency values at each point during the collection. Hover over the frequency P-State line to view a tooltip listing the frequency at each time point. |
 |
Wake up Band | Represents the wake-up objects that caused the core to switch from a sleep state to an active state. Each wake-up object type uses a unique color. By hovering over the band, you can view all of the wake-up objects at that point in time, including details such as wake-up object type, start time, and duration. |
 /
/ to expand the package and view the individual cores.