A newer version of this document is available. Customers should click here to go to the newest version.
Java* Code Analysis
Use the Intel® VTune™ Profiler to analyze Java* applications executed with Oracle* or OpenJDK* (Linux* only).
Even though Java code execution is handled with a Managed Runtime Environment, it can be as ineffective in terms of data management as in programs written using native languages. For example, if you are conscious about performance of your data mining Java application, you need to take into consideration your target platform memory architecture, cache hierarchy and latency of access to memory levels. From the platform microarchitecture point of view, profiling of Java applications is similar to profiling of native applications but with one major difference: to see performance metrics against their program source code, the profiling tool must be able to map metrics of the binary code either compiled or interpreted by the JVM back to the original source code in Java or C/C++.
VTune Profiler provides a low-overhead analysis of the JIT compiled code that is available for both user-mode sampling and tracing and hardware event-based sampling analysis types. The analysis of the interpreted Java methods is limited.
To enable the Java code analysis with the Intel® VTune™ Profiler and interpret data:
Configuring Java Data Collection
To configure your performance analysis for Java code, you may use either GUI or command line (vtune) configuration. You may run Java code analysis using one of the following modes:
To configure Java analysis in the Launch Application mode:
Embed your java command in a batch file or executable script.
For example, create a run.bat file on Windows* or run.sh file on Linux* with the following command:
Windows:
> java.exe -Xcomp -Djava.library.path=native_lib\ia32 -cp C:\Design\Java\mixed_stacks MixedStacksTest 3 2Linux:
$ java -Xcomp -Djava.library.path=native_lib/ia32 -cp /home/Design/Java/mixed_stacks MixedStacksTest 3 2Create a project.
In the Configure Analysis window > WHERE pane, specify your analysis system, for example, Local Host.
In the WHAT pane, choose the Application to Launch target type.
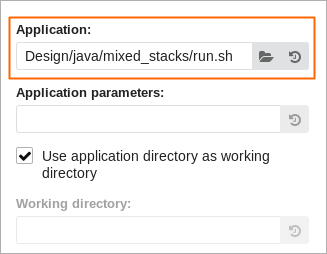
In the Application field, specify a path to this run file . For example, on Linux:
In the Advanced section, select the Auto Managed code profiling mode and enable the Analyze child processes option.
Similarly, you can configure an analysis with the VTune Profiler command line interface, vtune. For example, for the Hotspots analysis on Linux run the following command line:
$ vtune -collect hotspots -- run.shor directly:
$ vtune -collect hotspots -- java -Xcomp -Djava.library.path=native_lib/ia32 -cp home/Design/Java/mixed_stacks MixedStacksTest 3 2To configure Java analysis in the Attach to Process mode:
In case your Java application needs to run for some time or cannot be launched at the start of this analysis, you may attach the VTune Profiler to the standalone Java process. On Linux, you can also attach the VTune Profiler to a C/C++ application with an embedded JVM instance for hardware event-based sampling analysis types. To do this, select the Attach to Process target type in the WHAT pane and specify the java process name or PID.
You may use the command line interface to attach the analysis to the Java process. For example, the following command attaches the Hotspots analysis to the Java process:
$ vtune -collect hotspots -target-process javaThe following command line example attaches the Hotspots analysis to the Java process by its PID:
$ vtune -collect hotspots -target-pid 1234To configure Java analysis in the Attach to Process mode under Low-privilege Account (Linux* Only):
For hardware event-based sampling analysis types, you can attach the VTune Profiler running under the superuser account to a Java process or a C/C++ application with embedded JVM instance running under a low-privileged user account. For example, you may attach the VTune Profiler to Java based daemons or services.
To do this, run the VTune Profiler under the root account, select the Attach to Process target type and specify the java process name or PID.
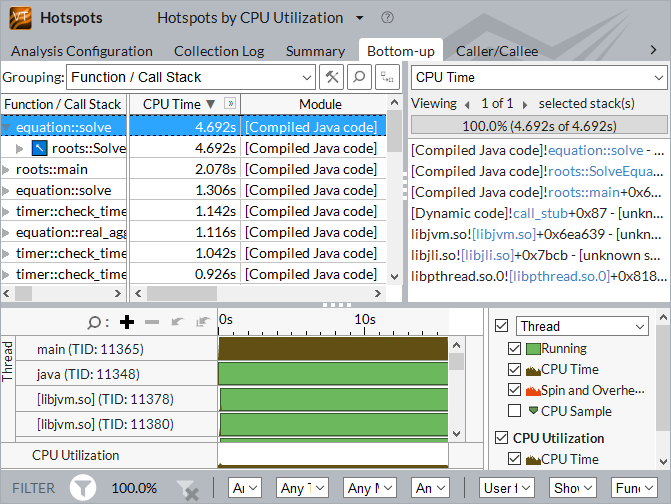
Identifying Hottest Methods
You may run the Hotspot analysis to get a list of the hottest methods along with their timing metrics and call stacks. The workload distribution over threads is also displayed in the Timeline pane. Thread naming helps to identify where exactly the most resource consuming code was executed. For example, on Linux*:
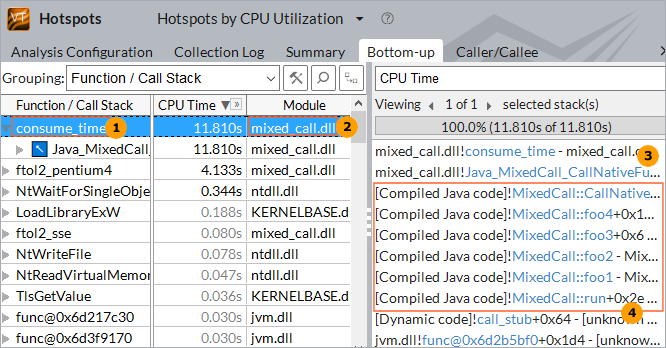
Analyzing Stacks for Mixed Code
If you are pursuing maximum performance on a platform, consider writing and compiling performance critical modules of your Java project in native languages like C or even assembly. This way of programming helps to employ powerful CPU resources like vector computing (implemented via SIMD units and instruction sets). In this case, compute-intensive functions become hotspots in the profiling results, which is expected as they do most of the job. However, you might be interested not only in hotspot functions, but in identifying locations in Java code these functions were called from via a JNI interface. Tracing such cross-runtime calls in the mixed language algorithm implementations could be a challenge.
To analyze mixed code profiling results, the VTune Profiler is "stitching" the Java call stack with the subsequent native call stack of C/C++ functions. The reverse call stacks stitching works as well. For example, on Windows*:
|
Native function |
|
Mixed native/Java call stack |
|
Native module |
|
Compiled methods in the Java call stack |


Due to inlining during the compilation stage, some functions may not appear in the stack by default. Make sure to select the Show inline functions option for the Inline Mode on the filter bar.
Analyzing Hardware Metrics
VTune Profiler also provides an advanced profiling option of optimizing Java applications for the CPU microarchitecture utilized in your platform. Although Java and JVM technology is intended to free a developer from hardware architecture specific coding, once Java code is optimized for the current Intel microarchitecture, it will most probably keep this advantage for future generations of CPUs. You may use the hardware event-based sampling data collection that monitors hardware events in the CPU's pipeline and can identify coding pitfalls limiting the most effective execution of instructions in the CPU. The CPU metrics are available and can be displayed against the application modules, functions, and Java code source lines. You may also run the hardware event-based sampling collection with stacks when you need to find out a call path for a function called in a driver or middleware layer in your system.
Limitations
VTune Profiler supports analysis of Java applications with some limitations:
System-wide profiling is not supported for managed code.
The JVM interprets some rarely called methods instead of compiling them for the sake of performance. VTune Profiler does not recognize interpreted Java methods and marks such calls as !Interpreter in the restored call stack.
If you want such functions to be displayed in stacks with their names, force the JVM to compile them by using the -Xcomp option (show up as [Compiled Java code] methods in the results). However, the timing characteristics may change noticeably if many small or rarely used functions are being called during execution.
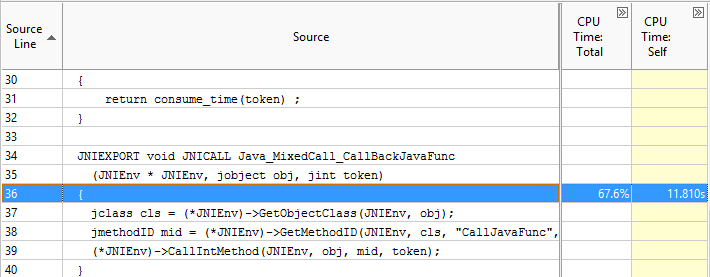
When opening source code for a hotspot, the VTune Profiler may attribute events or time statistics to an incorrect piece of the code. It happens due to JDK Java VM specifics. For a loop, the performance metric may slip upward. Often the information is attributed to the first line of the hot method's source code. In the example below, a real hotspot line consuming most CPU time is line 35.
Consider events and time mapping to the source code lines as approximate.
For the Hotspots analysis type in the user-mode sampling mode, the VTune Profiler may display only a part of the call stack. To view the complete stack on Windows, use the -Xcomp additional command line JDK Java VM option that enables the JIT compilation for better quality of stack walking.
To view the complete stack on Linux, use additional command line JDK Java VM options that change behavior of the Java VM:
Use the -Xcomp additional command line JDK Java VM option that enables the JIT compilation for better quality of stack walking.
On Linux* x86, use client JDK Java VM instead of the server Java VM: either explicitly specify -client, or simply do not specify -server JDK Java VM command line option.
On Linux x64, specify -XX:-UseLoopCounter command line option that switches off on-the-fly substitution of the interpreted method with the compiled version.
Java application profiling is supported for the Hotspots and Microarchitecture analysis types. Support for the Threading analysis is limited as some embedded Java synchronization primitives (which do not call operating system synchronization objects) cannot be recognized by the VTune Profiler. As a result, some of the timing metrics may be distorted.
There are no dedicated libraries supplying a user API for collection control in the Java source code. However, you may want to try applying the native API by wrapping the __itt calls with JNI calls.