A newer version of this document is available. Customers should click here to go to the newest version.
Memory Usage View
Use the Intel® VTune™ Profiler to analyze cache misses (L1/L2/LLC), memory loads/stores, memory bandwidth and system memory allocation/de-allocation, identify high bandwidth issues and NUMA issues in your memory-bound application.
To analyze memory usage data, run these analysis types:
Memory Access analysis
Microarchitecture Exploration analysis with the Analyze memory bandwidth option enabled
HPC Performance Characterization analysis with the Analyze memory bandwidth option enabled
When the analysis is complete, VTune Profiler opens the Memory Usage viewpoint. This viewpoint displays data per memory-access-correlated event-based metrics. Each metric is an event ratio defined by Intel architects and may have its own predefined threshold. VTune Profiler analyzes a ratio value for each aggregated program unit (for example, function). When this value exceeds the threshold and the program unit has more than 5% of CPU time from the collection CPU time, it signals a potential performance problem and highlights that value.
To interpret performance data obtained through the analysis, follow this procedure:
View performance metrics by memory objects (Linux* targets only).
Identify code sections and memory objects inducing bandwidth.
Analyze Topology, Memory, and Cross-Socket Bandwidth
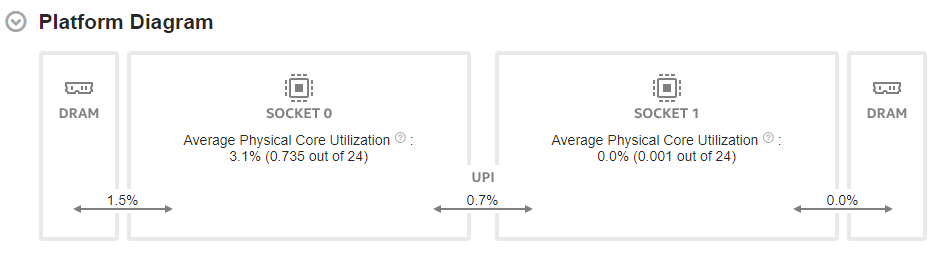
Start your performance analysis in the Summary window of the Memory Usage viewpoint. Here, the Platform Diagram displays system topology and utilization metrics for DRAM, Intel® UPI links, and physical cores.
Sub-optimal application topology can result in induced DRAM and Intel® QuickPath Interconnect (Intel® QPI) or Intel® Ultra Path Interconnect (Intel® UPI) cross-socket traffic. These incidents can limit performance.
The platform diagram is available for:
- All client platforms
- Server platforms based on Intel® microarchitecture code name Skylake, with up to four sockets.
If you selected the Evaluate max DRAM bandwidth option in your analysis configuration, the Platform Diagram shows the average DRAM utilization. Otherwise, it shows the average DRAM bandwidth.
The Average UPI Utilization metric displays UPI utilization in terms of transmit. Irrespective of the number of UPI links that connect a pair of packages, the Platform Diagram shows a single cross-socket connection, . If there are several links, the diagram displays the maximum value.
On top of each socket, the Average Physical Core Utilization metric indicates the utilization of physical cores by computations of the application under analysis.
Once you examine the topology and utilization information in the diagram, focus on other sections in the Summary window and then switch to the Bottom-up and Platform windows next.
View Performance Metrics by Memory Objects (Linux* targets only)
If you enabled the Analyze dynamic memory objects configuration option for the Memory Access analysis, you can configure the Memory Usage viewpoint to display performance metrics per memory objects (variables, data structures, arrays).
Memory objects identification is supported only for Linux targets and only for processors based on Intel microarchitecture code named Haswell and newer architectures. On Windows*, you can group by Cachelines, see the metrics against the code, and figure out what data structures it accesses.
There are several types of memory objects:
Dynamic memory objects are allocated on heap using the malloc, new, and similar functions. Such objects are identified by the line where an allocation happened; for example, a source line where the malloc function was called.
Global objects are global or static variables. Such objects are identified by the module and variable name, for example: libiomp5.sp!_kmp_avail_proc (4B), where 4B is an allocation size.
Stack objects are local variables. VTune Profiler does not recognize individual variables, so all references to stack memory are associated with one memory object named [Stack].
For memory objects data, click the Bottom-up tab and select a grouping level containing Memory Object or Memory Object Allocation Source. The Memory Object granularity groups the data by individual allocations (call site and size) while Memory Object Allocation Source groups by the place where an allocation happened.
Only metrics based on DLA-capable hardware events are applicable to the memory objects analysis. For example, the CPU Time metric is based on a non DLA-capable Clockticks event, so cannot be applied to memory objects. Examples of applicable metrics are Loads, Stores, LLC Miss Count, and Average Latency.
Identify Code Sections and Memory Objects Inducing Bandwidth
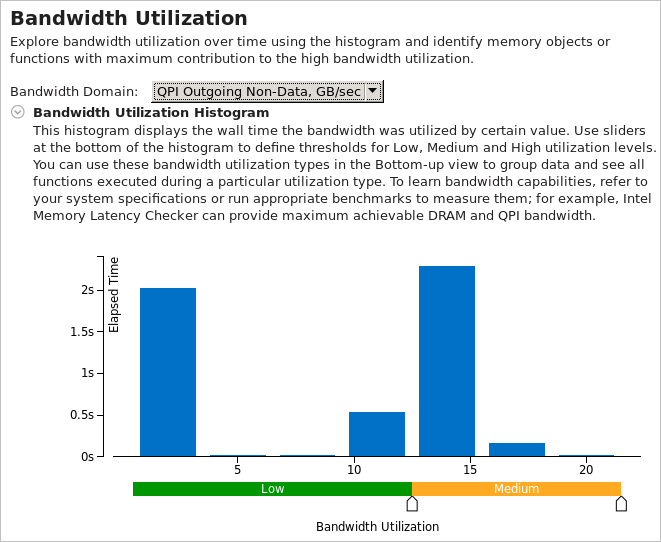
In the Bandwidth Utilization section of the Summary window, you can select a bandwidth domain (like DRAM or Interconnect) and analyze the bandwidth utilization over time represented on the histogram:
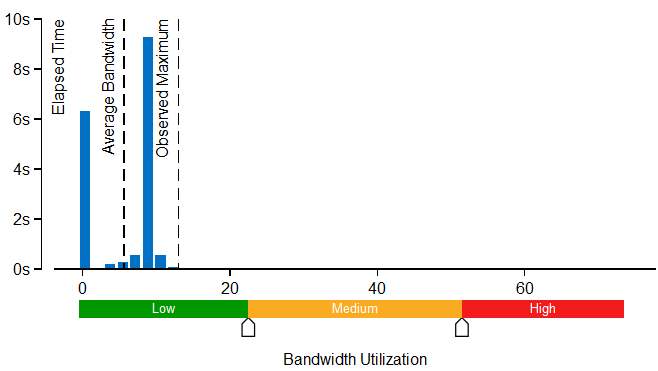
This histogram shows how much time the system bandwidth was utilized by the selected bandwidth domain and provides thresholds to categorize bandwidth utilization as High, Medium and Low. By default, for Memory Analysis results the thresholds are calculated based on the maximum achievable DRAM bandwidth measured by the VTune Profiler before the collection starts and displayed in the System Bandwidth section of the Summary window. To enable this functionality for custom analysis results, make sure to select the Evaluate max DRAM bandwidth option. If this option is not enabled, the thresholds are calculated based on the maximum bandwidth value collected for this result. You can also set the threshold by moving sliders at the bottom. The modified values will be applied to all subsequent results in this project.
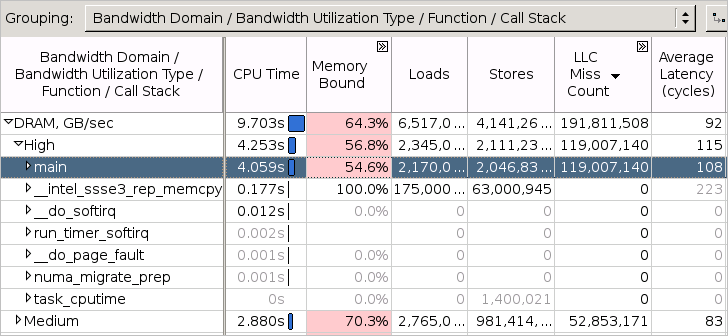
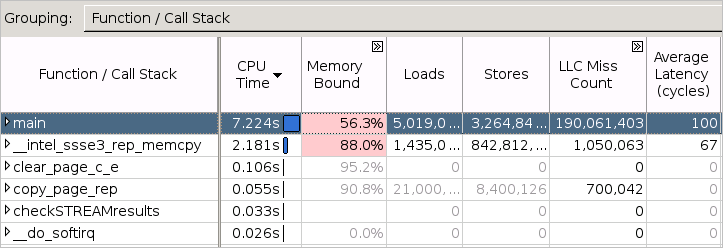
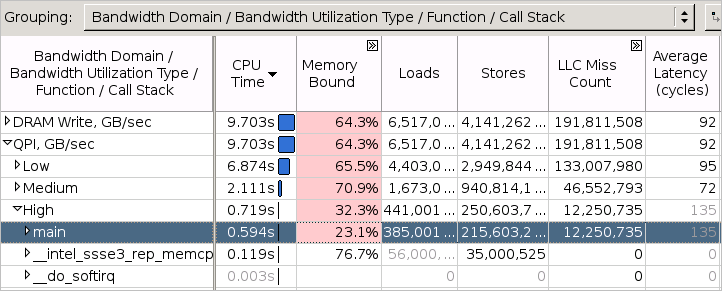
Explore the table under the histogram to identify which functions were frequently accessed while the bandwidth utilization for the selected domain was high. Clicking a function from the list opens the Bottom-up window with the grid automatically grouped by Bandwidth Domain / Bandwidth Utilization Type / Function / Call Stack and this function highlighted. Under the DRAM, GB/sec > High utilization type, you can see all functions executing when the system DRAM bandwidth utilization was high. Sort the grid by LLC Miss Count to see what functions contributed to the high DRAM bandwidth utilization the most:
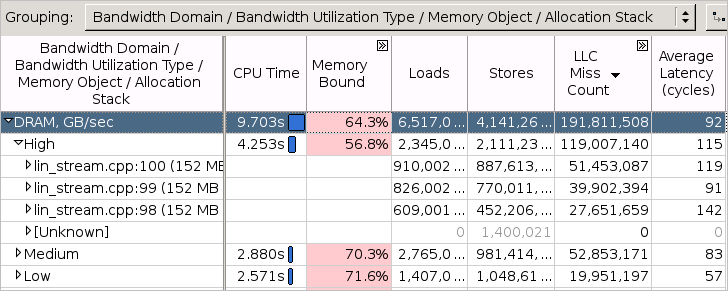
In addition to identifying bandwidth-limited code, the VTune Profiler provides a workflow to see the frequently accessed memory objects (variables, data structures, arrays) that had an impact on the high bandwidth utilization. So, if you enabled the memory object analysis for your target, the Bandwidth Utilization section includes a table with the top memory objects that were frequently accessed while the bandwidth utilization for the selected domain was high. Click such an object to switch to the Bottom-up window with the grid automatically grouped by Bandwidth Domain / Bandwidth Utilization Type / Memory Object / Allocation Stack and this object highlighted. Under the DRAM > High utilization type, explore all memory objects that were accessed when the system DRAM bandwidth utilization was high. Sort the grid by LLC Miss Count to see what memory objects contributed to the high DRAM bandwidth utilization the most:
Analyze Bandwidth Issues Over Time
To identify bandwidth issues in your application over time, focus on the Timeline pane provided at the top of the Bottom-up window. For Memory Analysis results, the DRAM Bandwidth graph is scaled according to the maximum achievable DRAM bandwidth measured by the VTune Profiler before the collection start. To enable this functionality for custom analysis results, make sure to select the Evaluate max DRAM bandwidth option. If this option is not enabled, the thresholds are calculated based on the maximum bandwidth value collected for this result.
Bandwidth events are not associated with any core, but, instead, associated with the uncore (iMC, the integrated memory controller). Uncore events happen on structures shared between all CPUs in a package (for example, 10 CPUs on a single package). This makes it impossible to associate any single uncore event with any code context. So, the VTune Profiler may only associate bandwidth uncore event counts with the socket, or package, on which the uncore event happened, and time.
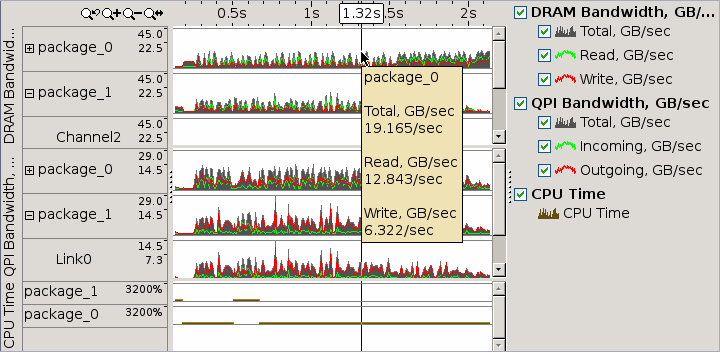
Hover over a bar with high bandwidth value to learn how much data was read from or written to DRAM through the on-chip memory controller. Use time-filtering context menu options to filter in a specific range of time during which bandwidth is notable. Then, switch to the core-based events that correlate with bandwidth in the grid below to determine what specific code is inducing all the bandwidth.
Identify Code and Memory Objects with NUMA Issues
Many modern multi-socket systems are based on the Non-Uniform Memory Architecture (NUMA) where accesses to the memory allocated on the home (local) CPU socket have better latency/bandwidth than accesses to the remote memory. To identify NUMA issues, focus on the following hierarchically organized metrics in the Bottom-up view:
Memory Bound > DRAM Bound > Local DRAM metric shows a fraction of cycles the CPU stalled waiting for memory loads from the local memory.
Memory Bound > DRAM Bound > Remote DRAM metric shows a fraction of cycles the CPU stalled waiting for memory loads from the remote memory.
Memory Bound > DRAM Bound > Remote Cache metric shows a fraction of cycles the CPU stalled waiting for memory loads from the remote socket cache.
LLC Miss Count > Local DRAM Access Count, LLC Miss Count > Remote DRAM Access Count, LLC Miss Count > Remote Cache Access Count - metrics show the number of accesses to local memory, remote memory and remote cache respectively.
The performance of your application can be also limited by the bandwidth of Interconnect links (inter-socket connections). VTune Profiler provides mechanisms to identify code and memory objects inducing this type of bandwidth similar to those used to identify DRAM bandwidth problems. In the Summary window, use the Bandwidth Utilization Histogram and select Interconnect in the Bandwidth Domain drop-down menu.
If you select the Interconnect Incoming/Outgoing Non-Data categories in the Bandwidth Domain drop-down menu, the histogram displays the bandwidth utilized by hardware generated and system traffic like protocol packet headers, snoop requests and responses, and others:
Interconnect bandwidth analysis is supported by the VTune Profiler for Intel microarchitecture code name Ivy Bridge EP and later.
Switch to the Bottom-up tab and select the Bandwidth Domain / Bandwidth Utilization type / Function / Call Stack grouping level. Expand the Interconnect domain grid row and then expand the High utilization type row to see all functions that were executing when the system Interconnect bandwidth utilization was high:
You can also select areas with the high Interconnect bandwidth utilization in the Timeline view and filter in by this selection:
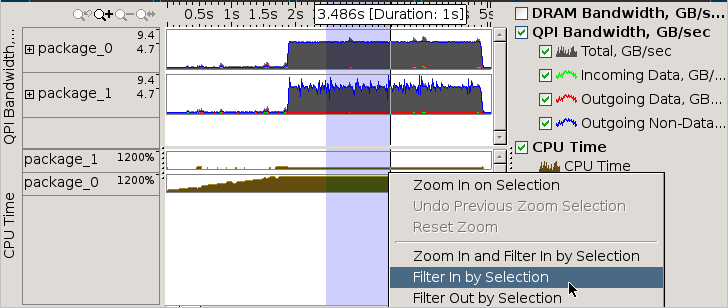
After the filter is applied, the grid view below the Timeline pane shows what was executing during that time range.
Analyze Source
When you identified a critical function, double-click it to open the Source/Assembly window and analyze the source code. The Source/Assembly window displays hardware metrics per code line for the selected function.
To view the Source/Assembly data for memory objects:
Select the ../Function / Memory Object /.. grouping level (the Function granularity should precede the Memory Object granularity) in the Bottom-up window.
Expand a function and double-click a memory object under this function.
The Source/Assembly window opens displaying metrics per function source lines where accesses to the selected memory object happened.
For information on processor event, see Intel Processor Event Reference.
For information on the performance tuning for HPC-computers using the event-based sampling collection, see http://software.intel.com/en-US/articles/processor-specific-performance-analysis-papers/.
For information on performance improvement opportunities with NUMA hardware, see https://software.intel.com/en-us/articles/performance-improvement-opportunities-with-numa-hardware.