Early Power Estimator for Intel® Cyclone® 10 LP FPGAs User Guide
3.2. Cyclone® 10 LP EPE - Logic Worksheet
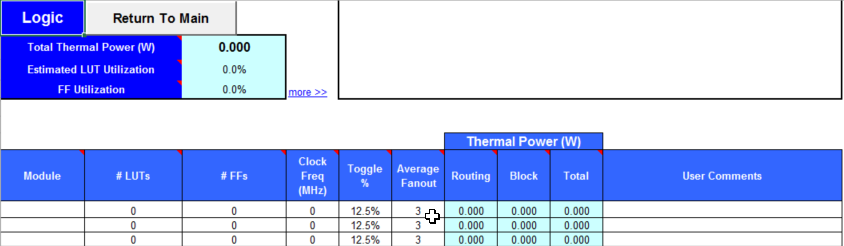
Enter the following parameters for each design module:
- Number of combinational adaptive look-up tables (ALUTs)
- Number of flipflops
- Clock frequency in MHz
- Toggle percentage
- Average fanout
| Column Heading | Description |
|---|---|
| Module | Specify a name for each module of the design. This is an optional entry. |
| #LUTs | Enter the number of look-up tables (LUTs). This is the “Combinational ALUTs” value from the Quartus® Prime Compilation Report Resource Usage Summary section. |
| #FFs | Enter the number of flipflops in the module. This is the sum of “Register ALUTs” and “Dedicated logic registers” from the Quartus® Prime Compilation Report Resource Usage Summary section. Clock routing power is calculated separately on the Clock worksheet of the EPE spreadsheet. |
| Clock Freq (MHz) | Enter a clock frequency (in MHz). This value is limited by the maximum frequency specification for the device family. 100 MHz with a 12.5% toggle means that each LUT or flipflop output toggles 12.5 million times per second (100 × 12.5%). |
| Toggle% | Enter the average percentage of logic toggling on each clock cycle. The toggle percentage ranges from 0 to 100%. Typically, the toggle percentage is 12.5%, which is the toggle percentage of a 16-bit counter. To ensure you do not underestimate the toggle percentage, use a higher toggle percentage. Most logic only toggles infrequently; therefore, toggle rates of less than 50% are more realistic. For example, a T-flipflop (TFF) with its input tied to VCC has a toggle rate of 100% because its output is changing logic states on every clock cycle. Refer to the 4-Bit Counter Example. |
| Average Fanout | Enter the average number of blocks fed by the outputs of the LUTs and flipflops. |
| Thermal Power (W)–Routing | This shows the power dissipation due to estimated routing (in watts). Routing power depends on placement and routing, which is a function of design complexity. The values shown represent the routing power based on experimentation of more than 100 designs. For detailed analysis based on your design’s routing, use the Quartus® Prime Power Analyzer. |
| Thermal Power (W)–Block | This shows the power dissipation due to internal toggling of the ALMs (in watts). Logic block power is a combination of the function implemented and the relative toggle rates of the various inputs. The EPE spreadsheet uses an estimate based on observed behavior across more than 100 real-world designs. For accurate analysis based on your design’s exact synthesis, use the Quartus® Prime Power Analyzer. |
| Thermal Power (W)–Total | This shows the total power dissipation (in watts). The total power dissipation is the sum of the routing and block power. |
| User Comments | Enter any comments. This is an optional entry. |
The first TFF with the cout0 LSB output has a toggle rate of 100% because the signal toggles on every clock cycle. The toggle rate for the second TFF with cout1 output is 50% because the signal only toggles on every two clock cycles. Consequently, the toggle rate for the third TFF with cout2 output and fourth TFF with cout3 output are 25% and 12.5%, respectively. Therefore, the average toggle percentage for this 4-bit counter is (100 + 50 + 25 + 12.5)/4 = 46.875%.
For more information about logic block configurations, refer to the Logic Array Blocks and Adaptive Logic Modules section of the Cyclone® 10 LP device handbook.