F-Tile Avalon® Streaming Intel® FPGA IP for PCI Express* User Guide
ID
683140
Date
2/03/2023
Public
A newer version of this document is available. Customers should click here to go to the newest version.
1. Acronyms
2. Introduction
3. IP Architecture and Functional Description
4. Advanced Features
5. Interfaces
6. Parameters
7. Testbench
8. Troubleshooting/Debugging
9. F-Tile Avalon Streaming Intel FPGA IP for PCI Express User Guide Archives
10. Revision History for the F-Tile Avalon Streaming Intel FPGA IP for PCI Express User Guide
A. Configuration Space Registers
B. Implementation of Address Translation Services (ATS) in Endpoint Mode
C. Packets Forwarded to the User Application in TLP Bypass Mode
D. Root Port Enumeration
E. Bifurcated Endpoint Support for Independent Resets
3.1. Architecture
3.2. Functional Description
3.3. Avalon-ST TX/RX
3.4. Interrupts
3.5. Completion Timeout
3.6. Hot Plug
3.7. Power Management
3.8. Configuration Output Interface (COI)
3.9. Configuration Intercept Interface (EP Only)
3.10. Hard IP Reconfiguration Interface
3.11. PHY Reconfiguration Interface
3.12. Page Request Service (PRS) (EP Only)
5.1. Overview
5.2. Clocks and Resets
5.3. Serial Data Interface
5.4. Avalon-ST Interface
5.5. Interrupt Interface
5.6. Hard IP Status Interface
5.7. Error Interface
5.8. 10-bit Tag Support Interface
5.9. Completion Timeout Interface
5.10. Power Management Interface
5.11. Hot Plug Interface (RP Only)
5.12. Configuration Output Interface
5.13. Configuration Intercept Interface (EP Only)
5.14. Hard IP Reconfiguration Interface
5.15. PHY Reconfiguration Interface
5.16. Page Request Service (PRS) Interface (EP Only)
5.17. FLR Interface Signals
5.18. PTM Interface Signals
5.19. VF Error Flag Interface Signals
5.20. VirtIO PCI Configuration Access Interface Signals
6.2.3.1. Device Capabilities
6.2.3.2. Link Capabilities
6.2.3.3. Legacy Interrupt Pin Register
6.2.3.4. MSI Capabilities
6.2.3.5. MSI-X Capabilities
6.2.3.6. Slot Capabilities
6.2.3.7. Latency Tolerance Reporting (LTR)
6.2.3.8. Process Address Space ID (PASID)
6.2.3.9. Device Serial Number Capability
6.2.3.10. Page Request Service (PRS)
6.2.3.11. Access Control Service (ACS) Capabilities
6.2.3.12. Power Management
6.2.3.13. Vendor Specific Extended Capability (VSEC) Registers
6.2.3.14. Precision Time Measurement (PTM)
6.2.3.15. Address Translation Services (ATS)
6.2.3.16. TLP Processing Hints (TPH)
6.2.3.17. VirtIO Parameters
7.6.1. ebfm_barwr Procedure
7.6.2. ebfm_barwr_imm Procedure
7.6.3. ebfm_barrd_wait Procedure
7.6.4. ebfm_barrd_nowt Procedure
7.6.5. ebfm_cfgwr_imm_wait Procedure
7.6.6. ebfm_cfgwr_imm_nowt Procedure
7.6.7. ebfm_cfgrd_wait Procedure
7.6.8. ebfm_cfgrd_nowt Procedure
7.6.9. BFM Configuration Procedures
7.6.10. BFM Shared Memory Access Procedures
7.6.11. BFM Log and Message Procedures
7.6.12. Verilog HDL Formatting Functions
A.3.1. Intel-Defined VSEC Capability Header (Offset 00h)
A.3.2. Intel-Defined Vendor Specific Header (Offset 04h)
A.3.3. Intel Marker (Offset 08h)
A.3.4. JTAG Silicon ID (Offset 0x0C - 0x18)
A.3.5. User Configurable Device and Board ID (Offset 0x1C - 0x1D)
A.3.6. General Purpose Control and Status Register (Offset 0x30)
A.3.7. Uncorrectable Internal Error Status Register (Offset 0x34)
A.3.8. Uncorrectable Internal Error Mask Register (Offset 0x38)
A.3.9. Correctable Internal Error Status Register (Offset 0x3C)
A.3.10. Correctable Internal Error Mask Register (Offset 0x40)
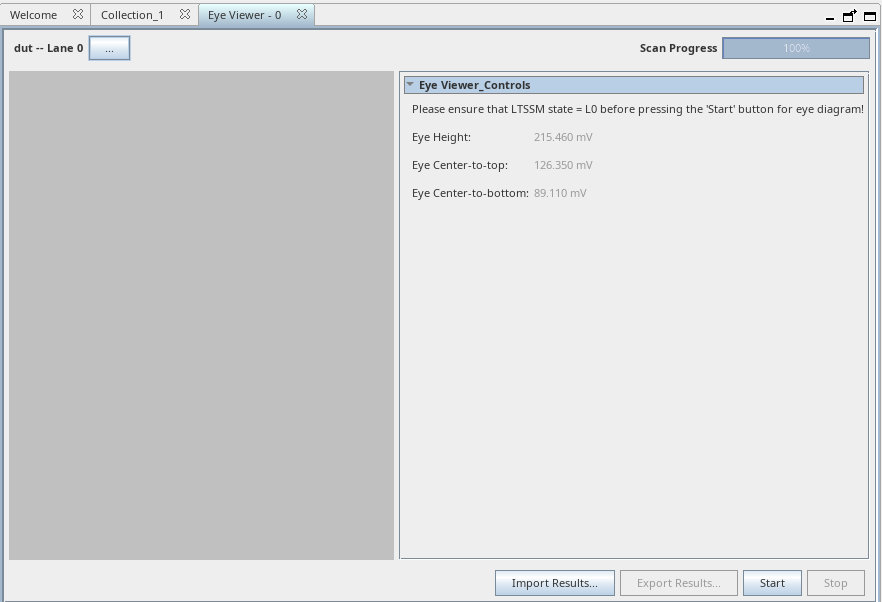
8.2.4.4. Eye Viewer
The F-Tile Debug Toolkit supports the Eye Viewer tool that allows you to measure the eye height margin for each channel. The Eye Viewer tool performs the eye measurement at BER = 1e-12, 95% confidence level.
Note: The F-Tile Avalon® Streaming Intel® FPGA IP for PCI Express* Eye Viewer feature of the Debug Toolkit does not support independent error sampler for performing eye margining performed on the actual data path. As a result, eye margining may produce uncorrectable errors in the data stream and cause the LTSSM to go to the Recovery state. You may mask out all errors (example AER registers) while performing eye margining and reset all error counters, error registers etc. after margining gets completed.
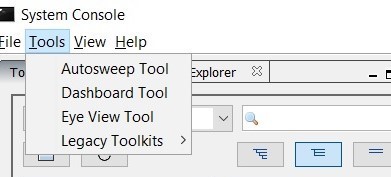
- In the System Console Tools menu option, click on Eye View Tool.
Figure 82. Opening the Eye Viewer
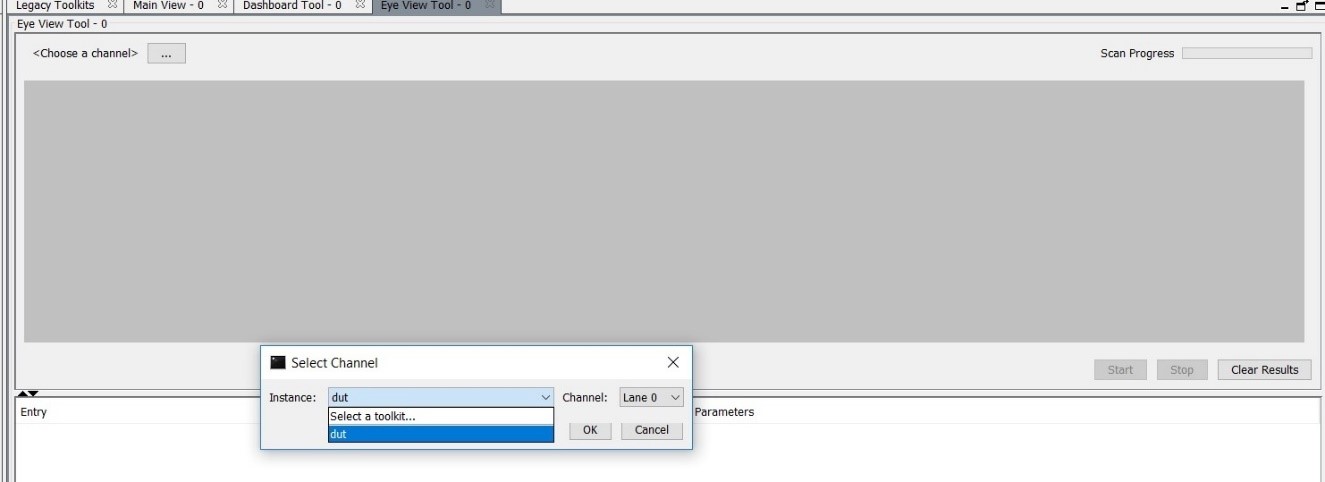
- This will open a new tab Eye View Tool next to the Main View tab. Choose the instance and channel for which you want to run the eye view tests.
Figure 83. Opening the Instance and Channel
- Click Start to begin the eye measurement for the selected channel.
- The messages window displays information messages to indicate the eye view tool's progress.
- Once the eye measurement completes, the eye height results are displayed.
Figure 84. Eye Viewer Results