Developer Guide
Intel oneAPI DPC++/C++ Compiler Handbook for Intel FPGAs
A newer version of this document is available. Customers should click here to go to the newest version.
System Viewer
The FPGA Optimization Report provides a graph that visualizes the structure of the generated verilog, which includes sizes and types of loads and stores, stalls, latencies, load and store information between kernels and different memories, pipes connected between kernels, and loops.
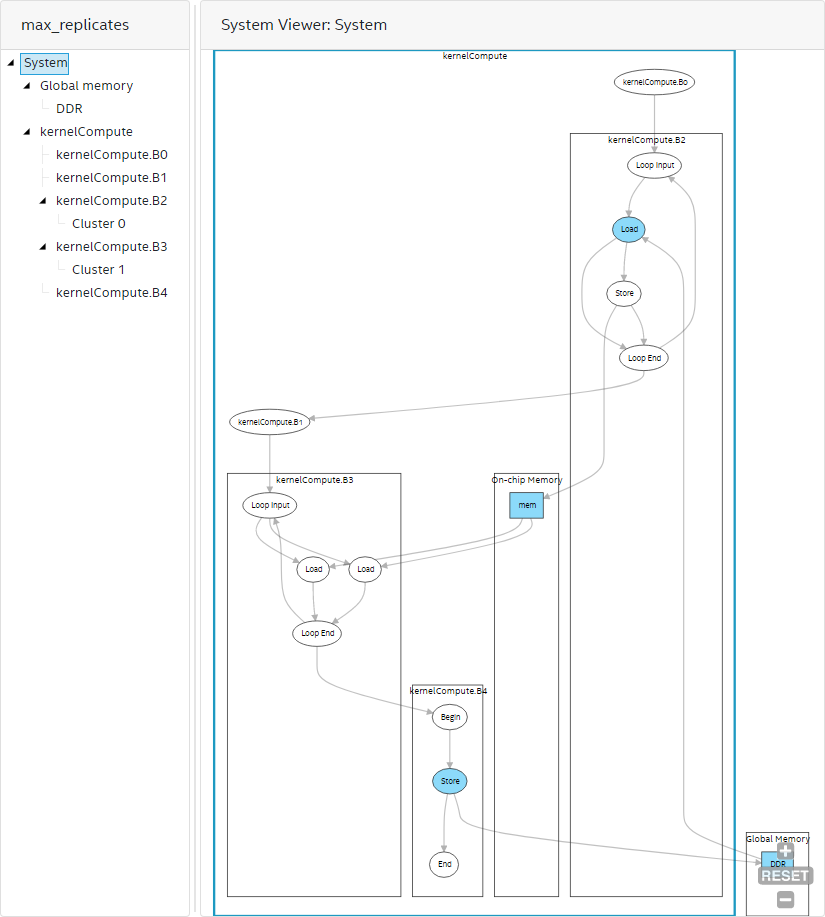
The System Viewer (see Figure 1) shows an abstracted netlist of your DPC++ system in a hierarchical graphical report consisting of system, global memory, block, and cluster views. It allows you to review information such as sizes, types, dependencies, and schedules of instructions, FIFO created by feedback nodes, FIFO created for capacity balancing in stallable regions, properties of interfaces such as pipe and memory interface, and view variables with loop-carried dependencies.
To view the System Viewer, click Views > System Viewer.
You can interact with the System Viewer in the following ways:
- Use the mouse wheel to zoom in and out within the System Viewer.
- Navigate through the following hierarchical views in the left-hand pane:
- System
- Global memory
- Block
- Cluster
- Click a node to display its location in the source code in the Code pane and node details in the Details pane.
System View
Use the system view of the System Viewer report to view various kernels in your system. The system view illustrates connections between your kernels and connections from kernels to memories. In addition, the system view shows the connection of blocks within a kernel and highlights blocks with a high initiation interval (II).
Global Memory View
The global memory view of the System Viewer provides a list of all global memories in the design. The global memory view shows the following:
- Connectivity within the system showing data flow direction between global memory and kernels.
- Memory throughput bottlenecks.
- Status of the compiler flags, such as -Xsnum-reorder and -Xsforce-single-store-ring.
- Global load-store unit (LSU) types.
- Type of write/read interconnects.
- Number of write rings.
- Number and connectivity of read-router buses.
The following image is an example of the global memory view in the System Viewer:

In Figure 2:
- When you select stores or loads, you can view respective lines in the source code and details about the LSU type and LSU-level bandwidth.
- For the write interconnect block, you can view the interconnect style, number of writes to the global memory, status of the -Xsforce-single-store-ring compiler flag, and number of store rings.
- For the read interconnect block, you can view the interconnect style and number of reads from the global memory.
- For the read interconnect router block, you can view the status of the -Xsnum-reorder flag, total number of buses, and all connections between buses and load LSUs. Buses in this block provide read data from the memory to load LSUs.
- For the global memory (DDR in Figure 2), you can view the status of interleaving, interleaving size, number of channels, maximum bandwidth the BSP can deliver, and channel width.
- For the memory controller block, you can view the maximum bandwidth the BSP can deliver, sum of the load/store throughput, and read/write bandwidth. For additional information about how global memory bandwidth use is calculated, refer to Global Memory Bandwidth Use Calculation in this guide. It describes the formulas used in calculating the bandwidth.
- LSUs using USM pointers show up twice in both host and device global memory views as they can access both memories.
Block View
The block view of the System Viewer provides a more granular system view of the kernel. This view shows the following:
- Fine-grained details within kernels (including instructions, dependencies, and schedule of the instructions) of the generated datapath of computations. The Intel® oneAPI DPC++/C++ Compiler encapsulates maximum instructions in clusters for better quality of results (QoR). The System Viewer shows clusters, instructions outside clusters, and their connections.
- Linking from the instruction back to the source line by clicking the instruction node.
- Various information about the instructions, such as data width, node's schedule information in the start cycle and latency, are provided if applicable.
The schedule information is relative to the start of each block. Because the Intel® oneAPI DPC++/C++ Compiler cannot statically infer the trip counts of blocks, if your design consists of multiple blocks, the compiler cannot compute the absolute schedule information by considering the trip counts. Moreover, the schedule information provides estimated values from empirical measurements for the stallable instructions (such as pipe RD/WR or memory LD/ST). The real schedule is likely to be different, and you must verify it with a hardware, or a simulation run.
If your design has loops, the Intel® oneAPI DPC++/C++ Compiler encapsulates the loop control logic into loop orchestration nodes and the initial condition of the loops into loop input nodes and their connection to the datapath.
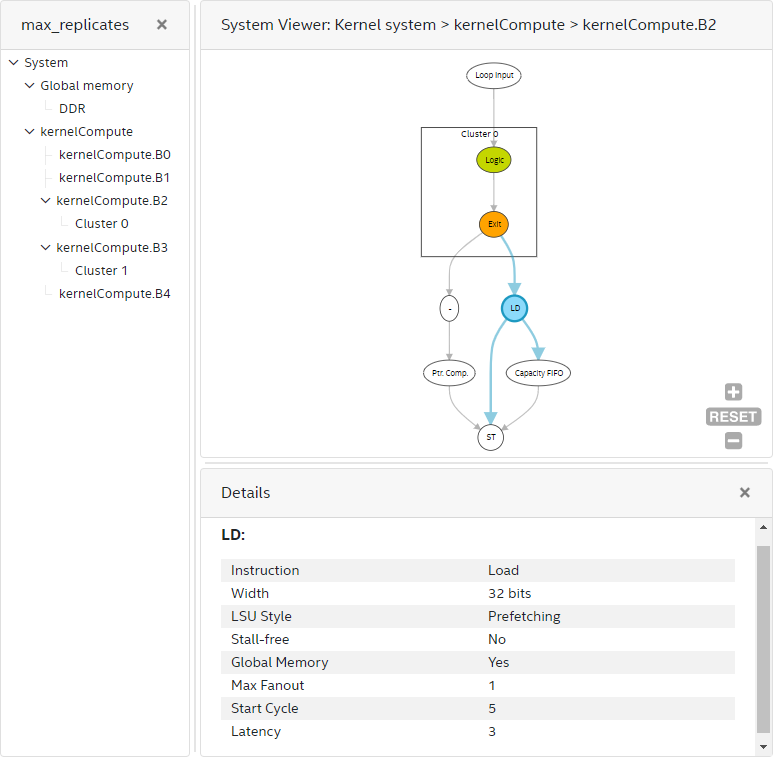
Inside a block, there are often pipe RD/WR or memory LD/ST nodes connecting to computation nodes or clusters. You can click on the computation nodes and view the Details pane (or hover over the nodes) to see specific instructions and the bit width. You can click on the RD/WR or LD/ST nodes to see information such as instruction type, width, depth, LSU type, stall-free global memory, scheduled start cycle, estimated latency, and schedule of a pipe or an LSU from the Details pane. For stallable nodes, the latency value provided is an estimate. Perform a simulation or hardware run for more accurate latency values.
If your design has clusters, a cluster has a FIFO in its exit node to store any pipelined data in-flight. You can click on the cluster exit node to find the exit FIFO width and depth attribute. The cluster exit FIFO size is also available in the cluster view of the System Viewer.
Cluster View
The cluster view of the System Viewer provides more granular graph views of the system or kernel. It helps in viewing clusters inside a block, and it shows all variables inside a cluster that have a loop-carried dependency. This view shows the following:
- Fine-grained details within clusters (including instructions and dependencies of the instructions) of the generated datapath of computations.
- Linking from the instruction back to the source line by clicking the instruction node.
- Various information about the instructions, such as data width, node’s schedule information in start cycle, and latency, are provided if applicable.
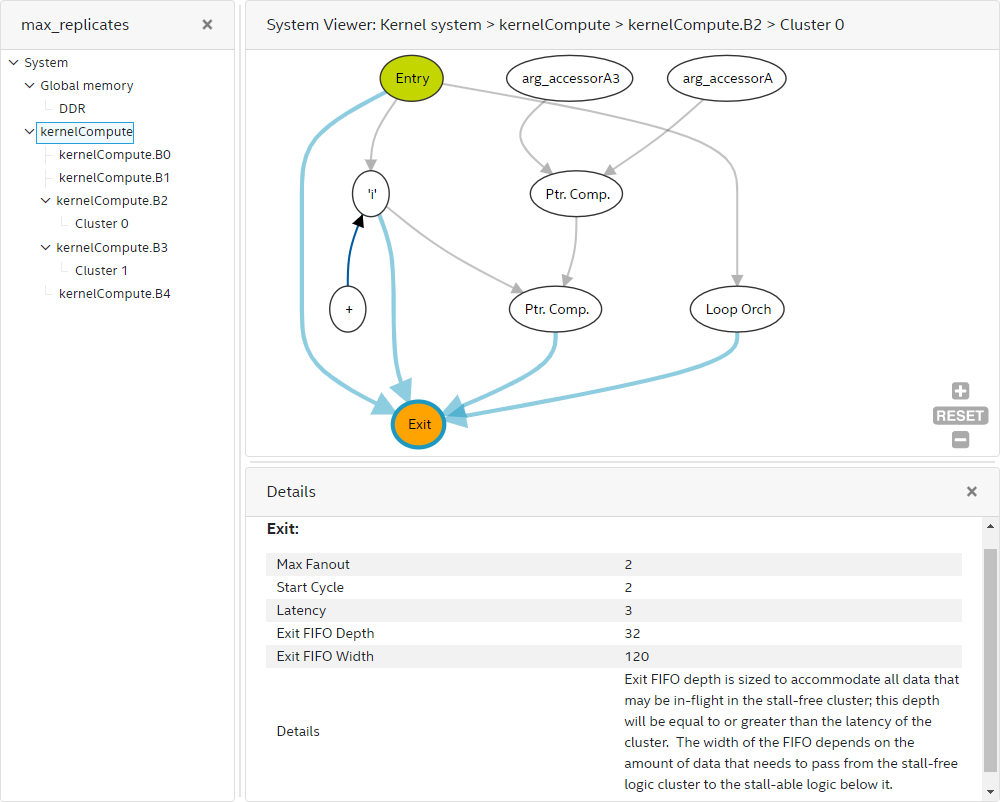
A cluster starts with an entry node and ends with an exit node. The cluster exit node has a FIFO of depth greater than or equal to the latency of the cluster to store any data in-flight. You can find the size of the cluster exit FIFO by clicking on the exit node. The cluster exit FIFO size information is also available in the block view of the System Viewer when you click on the exit node.
A cluster has a FIFO in its exit node to store any pipelined data in-flight. You can click on the cluster exit node to find the exit FIFO width and depth attribute. The cluster exit FIFO size is also available in the cluster view of the System Viewer.
Besides computation nodes, when your design contains loops, you can see loop orchestration nodes and variable nodes along with their Feedback nodes. The compiler generates the loop orchestration logic for loops in your design. Loop orchestration nodes represents this logic in the cluster view of the System Viewer. A variable node corresponds to a variable that has a loop-carried dependency in your design. A variable node goes through various computation logic and finally feeds to a Feedback node that connects back to the variable node. This back edge means that the variable is passed to the next iteration after the new value is evaluated. Scan for loop-carried variables that have a long latency to the Feedback nodes as they can be the II bottlenecks. You can cross-check by referring to the Loop Analysis report for more information about the II bottleneck. The Feedback node has a FIFO to store any data in-flight for the loop and is sized to d*II where d is the dependency distance, and II is the initiation interval. You can find the cluster exit FIFO size by clicking on the feedback node and looking at the Details pane or the pop-up box.
The dependency distance is the number of iterations between successive load/store nodes that depend on each other.