Developer Guide
Intel oneAPI DPC++/C++ Compiler Handbook for Intel FPGAs
A newer version of this document is available. Customers should click here to go to the newest version.
Configure Running and Debugging in a Visual Studio* Code Project
You can use the special version of GNU* GDB (gdb-oneapi) provided by the Intel® oneAPI Base Toolkit to debug your kernel through Visual Studio* Code (VS Code*) by following the instructions provided in Using Visual Studio Code with Intel® oneAPI Toolkits User Guide.
You can also use your native debugger if you disable code optimizations when you compile your code.
Before you can debug your application in VS Code*, you must configure running and debugging in your VS Code* project. You must complete the following instructions for each oneAPI project that you want to enable running and debugging in:
- Follow the steps in Set the Environment Variables and Launch Visual Studio* Code to launch VS Code* with the required oneAPI environment.
- Open the project file that you want to enable running and debugging for.
- If you have not yet compiled your project for debugging, compile your source code for emulation.
- Linux: Ensure that you include the -g and -O0 compiler command options. The -g option enables debugging and the -O0 option disables code optimizations.
icpx -fsycl -fintelfpga -g -O0 <kernel code.cpp> -o fpga_emu
IMPORTANT:Disable code optimizations with the -O0 option only for emulation. Do not disable code optimizations for simulation or hardware compilation. - Windows: Ensure that you include the /DEBUG and /Od compiler command options. The /DEBUG option enables debugging and the /Od option disables code optimizations.
icx-cl -fsycl -fintelfpga /DEBUG /Od /EHsc <kernel code.cpp> -o fpga_emu.exe
IMPORTANT:Disable code optimizations with the /Od option only for emulation. Do not disable code optimizations for simulation or hardware compilation.
If you are compiling a code sample, CMake generates the debug flags for you:
- Linux::
mkdir build
cd build
cmake <path_to_CMakeLists.txt>  -DCMAKE_BUILD_TYPE=Debug
make fpga_emu
- Windows:
mkdir build
cd build
cmake <path_to_CMakeLists.txt> -G "NMake Makefiles" -DCMAKE_BUILD_TYPE=Debug
nmake fpga_emu
- Linux: Ensure that you include the -g and -O0 compiler command options. The -g option enables debugging and the -O0 option disables code optimizations.
- Click the Run and Debug icon in the Activity Bar (or press Ctrl+Shift+D).
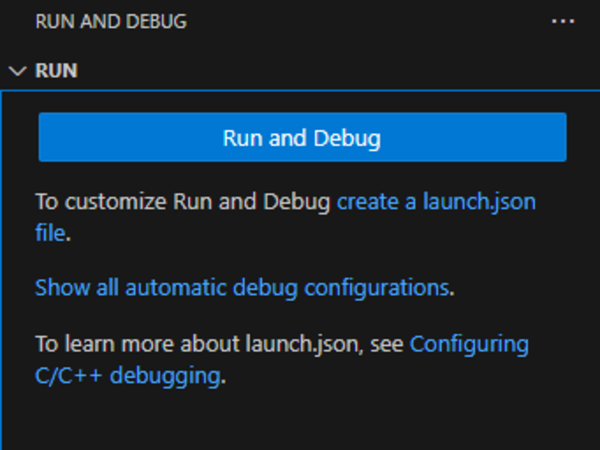
- Click create a launch.json file.
- Select your debugger as follows:
- Linux: C++ (GDB/LLDB)
- Windows: C++ (Windows)
- Add the configuration to your launch.json file as follows:
- Place your cursor in between the [] of the "configurations":[] line and press Ctrl+Space to select from available launch templates:
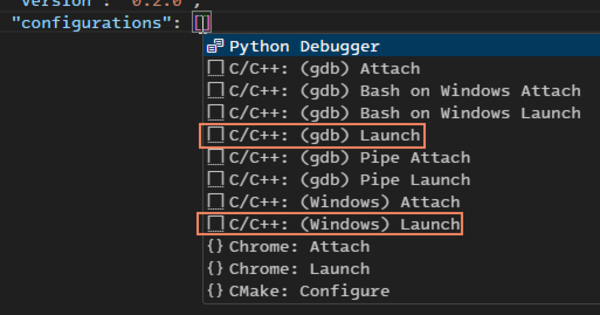
- Select a template as follows:
- Linux: Select C/C++: (gdb) Launch
- Windows: Select C/C++: (Windows) Launch
- Update the "program": "enter program name, for example ${workspaceFolder}/a.exe", pair to point at the executable file (generated when you compiled your kernel for emulation) that you want to debug.
- Place your cursor in between the [] of the "configurations":[] line and press Ctrl+Space to select from available launch templates:
- Save the launch.json file and close it.