Developer Guide
Intel oneAPI DPC++/C++ Compiler Handbook for Intel FPGAs
A newer version of this document is available. Customers should click here to go to the newest version.
Debugging Your Kernel in Visual Studio* Code with a Native Debugger
Before debugging in Visual Studio* Code (VS Code*) with a native debugger on, ensure that you have completed the initial configuration as described in Configure Running and Debugging in a Visual Studio* Code Project.
The instructions that follow assume that you have followed the steps in Set the Environment Variables and Launch Visual Studio* Code to launch VS Code* with the required oneAPI environment and have opened the project that you want to debug.
(Linux) Debugging in VS Code* with GDB
To debug in VS Code* with GDB:
- If you have not yet compiled your project for debugging, compile your source code for emulation. Ensure that you include the -g and -O0 compiler command options. The -g option enables debugging and the -O0 option disables code optimizations.
icpx -fsycl -fintelfpga -g -O0 <kernel code.cpp> -o fpga_emu
If you are compiling a code sample, CMake generates the debug flags for you:IMPORTANT:Disable code optimizations with the -O0 option only for emulation. Do not disable code optimizations for simulation or hardware compilation.mkdir build cd build cmake .. -DCMAKE_BUILD_TYPE=Debug make fpga_emu
- If necessary, update the "program": "", pair in your launch.json file to point at the executable file that you want to debug.
- Click the Run and Debug icon in the Activity Bar (or press Ctrl+Shift+D).
- At the top of the Run and Debug Side Bar, ensure that the correct debugger is selected:
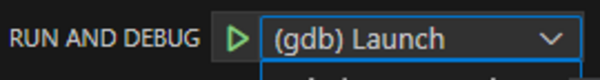
- Press F5 (or click the arrow on the left of the selected debugger) to start debugging.
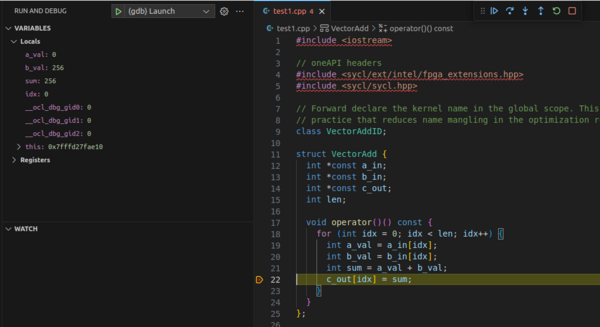
The debugger automatically stops at any breakpoints that you have set in your code. You can inspect your variables and step through the code as you would with any GUI-based debugger.
(Windows) Debugging in VS Code* with the Visual Studio* Windows Debugger
To debug in VS Code* with the the Visual Studio* Windows Debugger:
- If you have not yet compiled your project for debugging, compile your source code for emulation. Ensure that you include the /DEBUG and /Od compiler command options. The /DEBUG option enables debugging and the /Od0 option disables code optimizations.
icx-cl -fsycl -fintelfpga /DEBUG /Od /EHsc <kernel code.cpp> -o fpga_emu.exe
IMPORTANT:Disable code optimizations with the /Od option only for emulation. Do not disable code optimizations for simulation or hardware compilation.If you are compiling a code sample, CMake generates the debug flags for you:
mkdir build
cd build
cmake .. -G "NMake Makefiles" -DCMAKE_BUILD_TYPE=Debug
nmake fpga_emu
- If necessary, update the "program": "", pair in your launch.json file to point at the executable file that you want to debug.
- Click the Run and Debug icon in the Activity Bar (or press Ctrl+Shift+D).
- At the top of the Run and Debug Side Bar, ensure that the correct debugger is selected:
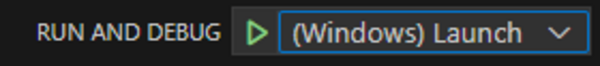
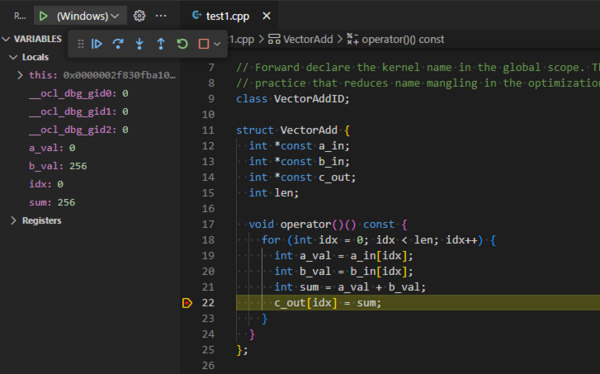
- Press F5 (or click the arrow on the left of the selected debugger) to start debugging.
The debugger automatically stops at any breakpoints that you have set in your code. You can inspect your variables and step through the code as you would with any GUI-based debugger.