Intel® Advisor User Guide

ID 766448
Date 11/07/2023
Public

A newer version of this document is available. Customers should click here to go to the newest version.

Document Table of Contents

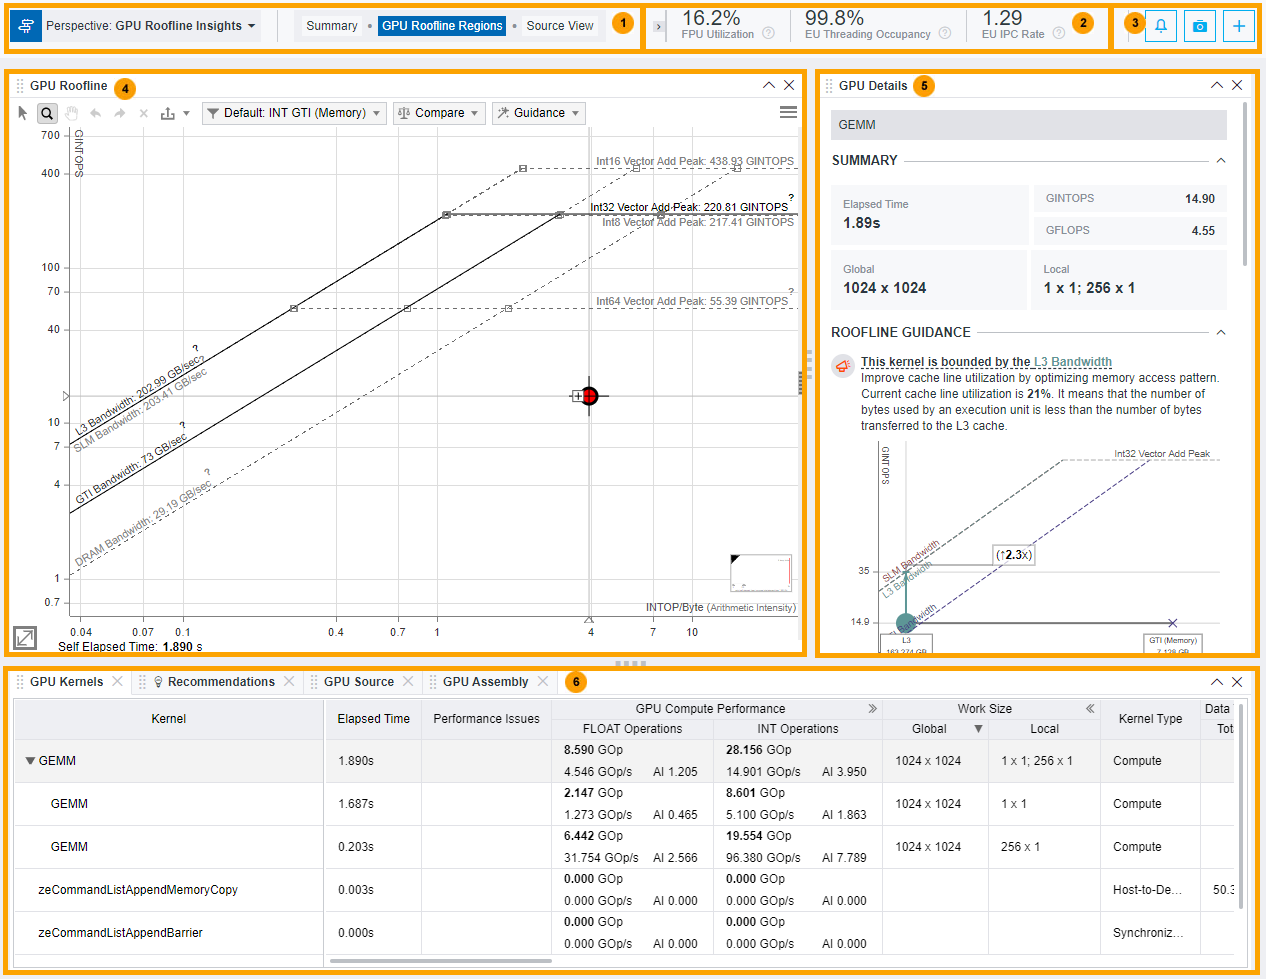
Window: GPU Roofline Regions

Use the GPU Roofline Regions window to view GPU metrics for your kernels in the grid, visualize kernel performance and identify room for optimization using a GPU Roofline chart, and view detailed information about how well a specific kernel utilizes compute and memory bandwidth.

NOTE:
Families of Intel® Xe graphics products starting with Intel® Arc™ Alchemist (formerly DG2) and newer generations feature GPU architecture terminology that shifts from legacy terms. For more information on the terminology changes and to understand their mapping with legacy content, see GPU Architecture Terminology for Intel® Xe Graphics.

Review the controls available in the main report of the GPU Roofline Insights perspective of Intel® Advisor. In the GPU Roofline Regions and Summary tabs, you can drag-and-drop, close/open, collapse/expand panes to change the report layout.

  • Switch between perspectives using a drop-down menu in the top left corner.
  • Switch between Summary, GPU Roofline Regions, and Source View.

Review the summary metrics for parts of your application executed on an accelerator.

  • Expand/collapse a top slider with per-program recommendations using the button:
    • Expand or collapse each recommendation.
    • Pin recommendations pane by clicking the button.

  • Expand/collapse a top slider with collection event log using the button. The top slider enables you to view the following:
    • Main data collection events and issues in the Featured Events pane.

      Expand/collapse each featured event in the log to view details.

    • Application Output. Use a toggle in the upper right corner of the view to show/hide the application output.
    • Full execution log of your application in the Collection Log pane.

    Click the button to collapse the top slider or drag it to maximize the event log.

    TIP:
    Collection event log top slider appears automatically when you run a perspective. You can track collection using the green progress bar at the top and view collection events online.
  • Create a snapshot for the current project results using the 
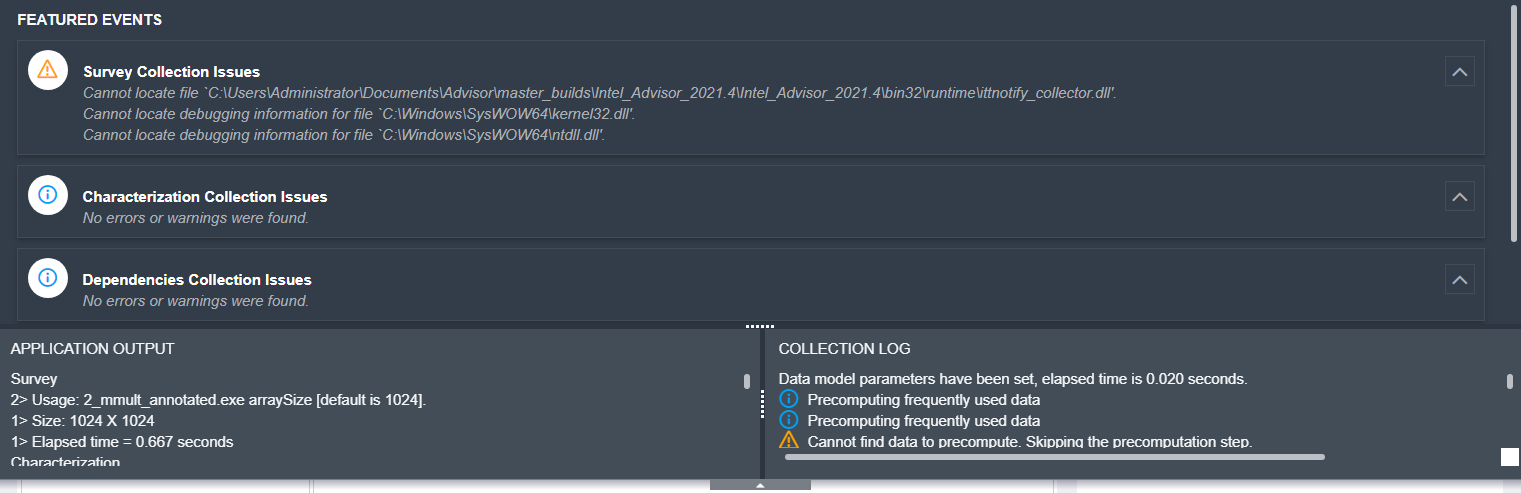
button. For details, see Create a Read-only Result Snapshot.

  • Click a + button to open previously closed panes. With this button, you can add the following panes:
    • CPU Roofline pane that enables you to view the actual performance of functions/loops executed on a CPU against hardware-imposed performance ceilings visualized on a Roofline chart.

      For details about interpretation, see Examine Bottlenecks on CPU Roofline Chart.

    • CPU pane that enables you to review performance metrics of your application performance on a CPU and compare tem with performance metrics on an accelerator. For details, see CPU Metrics.

Review the actual performance of GPU kernels in your application against hardware-imposed performance ceilings using the GPU Roofline chart.

For details about interpretation, see Examine Bottlenecks on GPU Roofline Chart.

See detailed description of GPU Roofline chart controls in Pane: GPU Roofline Chart.

Use the GPU Details tab to view the detailed information about the execution of a selected kernel:

  • View program metrics for a selected kernel in the Summary pane.
  • Identify the memory level your selected kernel is bounded by using the Roofline Guidance pane.
  • Explore the compute operations count and memory level utilization metrics in the OP/S and Bandwidth pane. Use the drop-downs to view the operations count, memory traffic, and arithmetic intensity (AI) for floating-point and integer operations at different memory levels.
  • View how the selected kernel impacts each memory level and explore the amount of data passed through each memory level using the Memory Metrics pane.
  • Explore the ratio of compute, memory and other instructions grouped by types in the Instruction Mix pane.
  • Get detailed overview of instruction types used during the execution of your application using the Instruction Mix Details pane. Use the drop-downs to expand each instruction category and view the included instruction types and instruction count. For compute category, Intel Advisor determines the data type. The dominating data type in th entire kernel is highlighted blue. Filter instructions by type and dominating data type using a filter button.
  • View how th loops in a selected kernel utilize the execution unit (EU) in the Performance Characteristics pane.

Switch between GPU Source and GPU Assembly tabs to:

  • Examine the source code and offload details for each source line. Select a loop in the GPU table or a dot in the GPU Roofline to focus on the corresponding parts of source and assembly code.

  • Review GPU assembly representation for a selected kernel. Select a code line to highlight the corresponding part in source code.

For details about interpreting GPU Roofline Insights perspective results, see Explore GPU Roofline Results

Use the Recommendations tab to view actionable recommendations helping you improve performance of the currently selected kernel. Expand a recommendation to view more information and a code snippet.

Review performance metrics of your application performance on a GPU accelerator. For details about metrics, see Accelerator Metrics.